Data Modeling Explained: A Principal Engineer's Guide
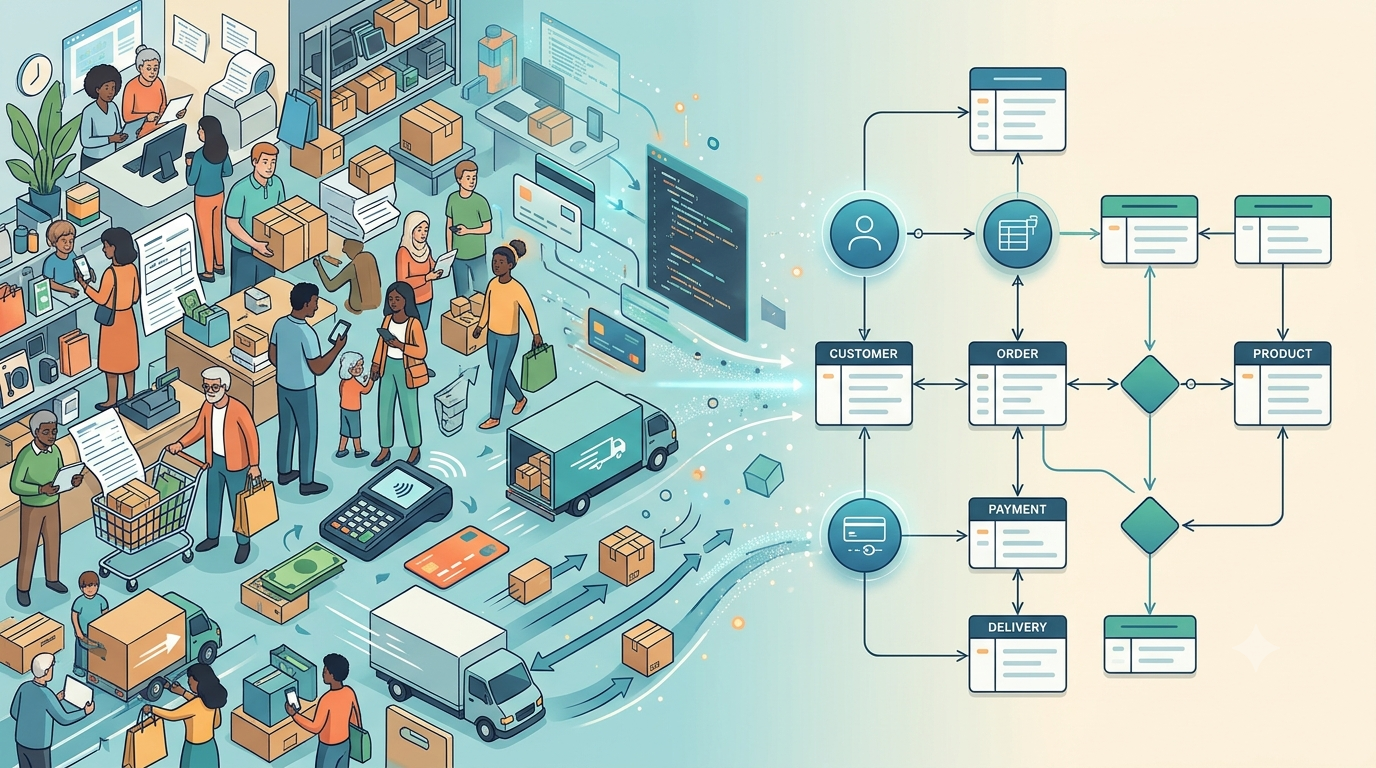
Imagine you're building an online shopping platform.
A customer opens the application, searches for a laptop, adds it to the cart, applies a discount, makes a payment, and waits for delivery.
Everything works perfectly.
Now the business asks a few simple questions:
- How many customers purchased something today?
- Which products generated the highest revenue?
- How many orders were cancelled?
- What was the customer's address when the order was placed?
- How much revenue did we actually earn after discounts and refunds?
You run a few SQL queries.
The numbers don't match.
The Sales team reports $2 million in revenue. Finance reports $1.7 million. The Product team reports a different number of orders.
Suddenly, everyone is looking at the Data Engineering team.
The pipelines are green. The Spark jobs completed. The dashboards are available.
So, what went wrong?
It might not be a pipeline problem. It might not be a SQL problem. It might be something much more fundamental.
We never agreed on how the business should be represented in data.
And that is exactly where Data Modeling enters the picture.
A data model is not just a collection of tables, columns, and relationships. It is the way we translate the real world into something a computer can store, understand, process, and query.
Let's build that understanding step by step.
1. What exactly is Data Modeling?
Think about a house.
Before construction starts, an architect doesn't simply ask the construction team to start placing bricks.
There is a plan.
The plan describes the rooms, doors, windows, measurements, connections, and overall structure. It helps everyone understand what needs to be built before the actual construction begins.
Data modeling follows a similar idea.
Before creating tables in a database, we decide:
- What information needs to be stored?
- What are the important business objects?
- How are those objects connected?
- What rules should the data follow?
- How should the information be accessed?
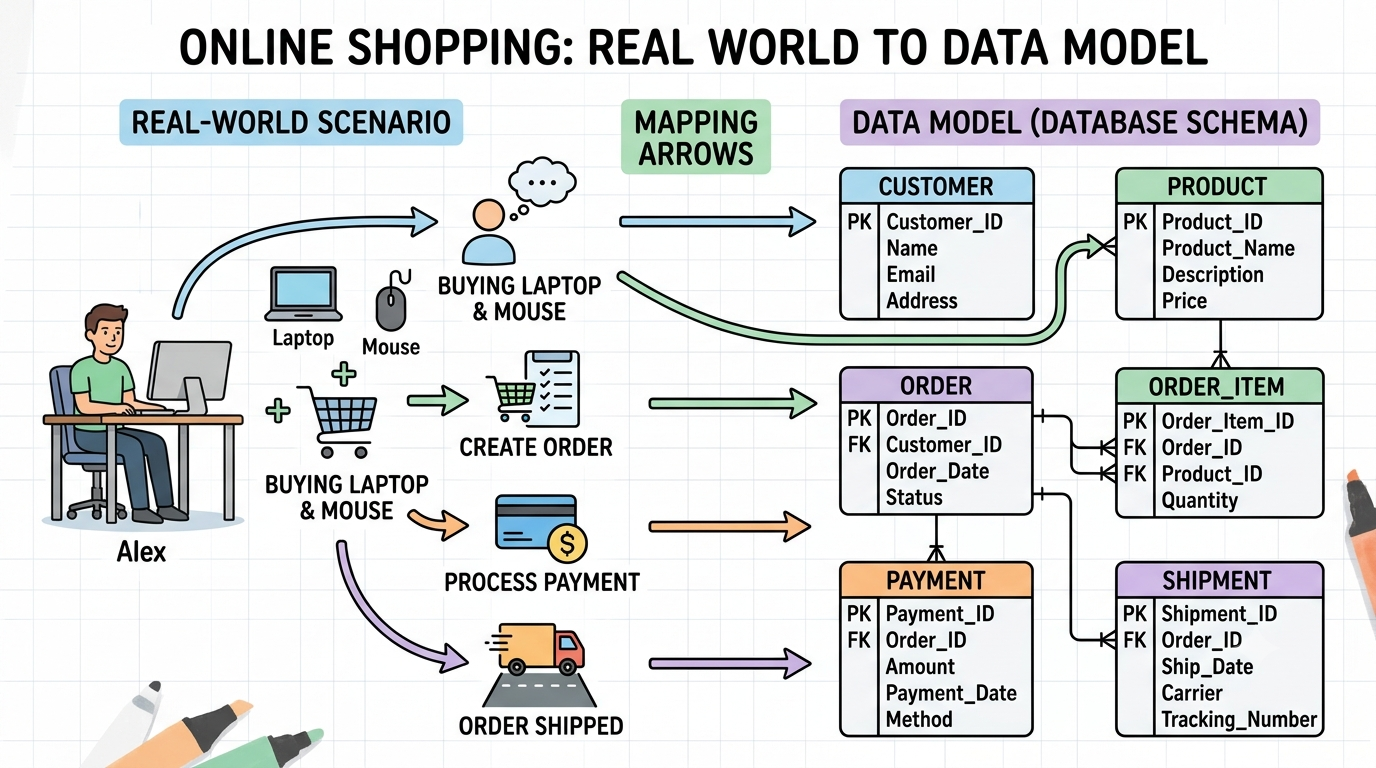
For our shopping platform, we might identify customers, products, orders, payments, and shipments.
These are not random table names. They represent real things that exist in the business.
A customer places an order. An order contains products. A payment is made against an order. A shipment delivers the purchased items.
Data modeling helps us represent these relationships in a structured way.
In simple terms:
Data Modeling is the process of understanding business information and designing how that information should be represented, connected, stored, and used.
One thing worth remembering: a good data model should make business meaning clear. A technically perfect table that nobody understands is not a great data model.
And yes, I have seen designs where a column called status_2 somehow became an important business field. Let's try not to create more of those.
2. How does Data Modeling actually work?
Let's continue with our shopping platform.
The business says:
"We need to store customer details, allow customers to place orders, accept payments, and track deliveries."
A developer might immediately start creating tables.
But a Principal Engineer should pause and ask a few questions first.
Can one customer place multiple orders? Can one order contain multiple products? Can an order have multiple payments? What happens if a customer changes their address after placing an order?
These questions matter because they influence the structure of the data.
Let's say customer Sarah places an order for a laptop and a mouse.
The business process looks something like this:
Customer → Order → Products → Payment → Shipment
But notice something important.
An order can contain multiple products. A product can also appear in thousands of different orders.
That means we have a many-to-many relationship between orders and products.
We need a way to represent that relationship.
A common solution is an order_items entity.
Our model could look like this:
CUSTOMER
--------
customer_id
customer_name
email

ORDER
-----
order_id
customer_id
order_date
order_status

ORDER_ITEM
----------
order_item_id
order_id
product_id
quantity
unit_price

PRODUCT
-------
product_id
product_name
category
current_price

PAYMENT
-------
payment_id
order_id
payment_amount
payment_status
payment_date
Now we have a structure that represents the business more accurately.
One customer can have many orders. One order can have many order items. Each order item refers to a product.
Notice that we haven't discussed Spark, Databricks, Snowflake, Delta Lake, or any database yet.
We are still solving the business problem.
That is an important distinction.
Data modeling starts with business meaning, not with the technology we plan to use.
3. The three levels of Data Modeling
Here's where things become interesting.
A common mistake is to jump directly into creating database tables.
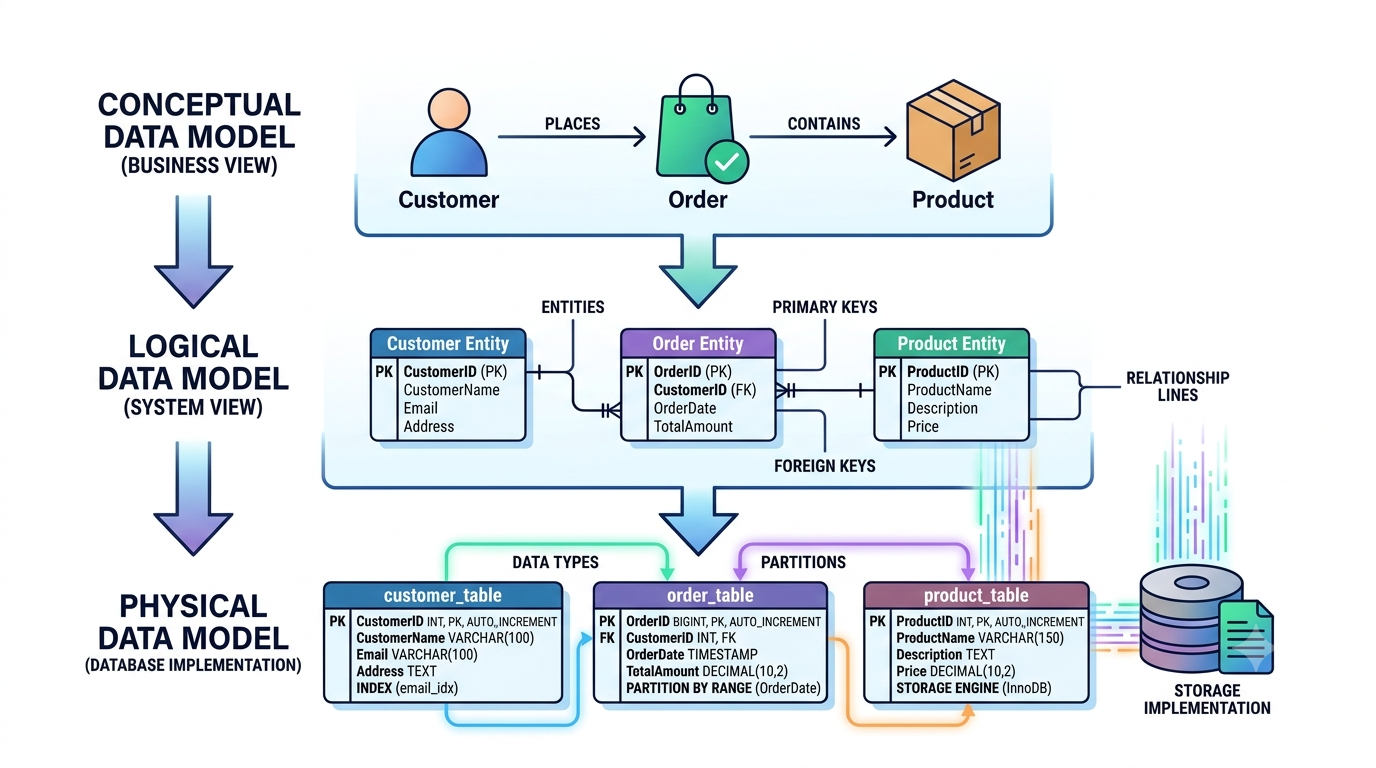
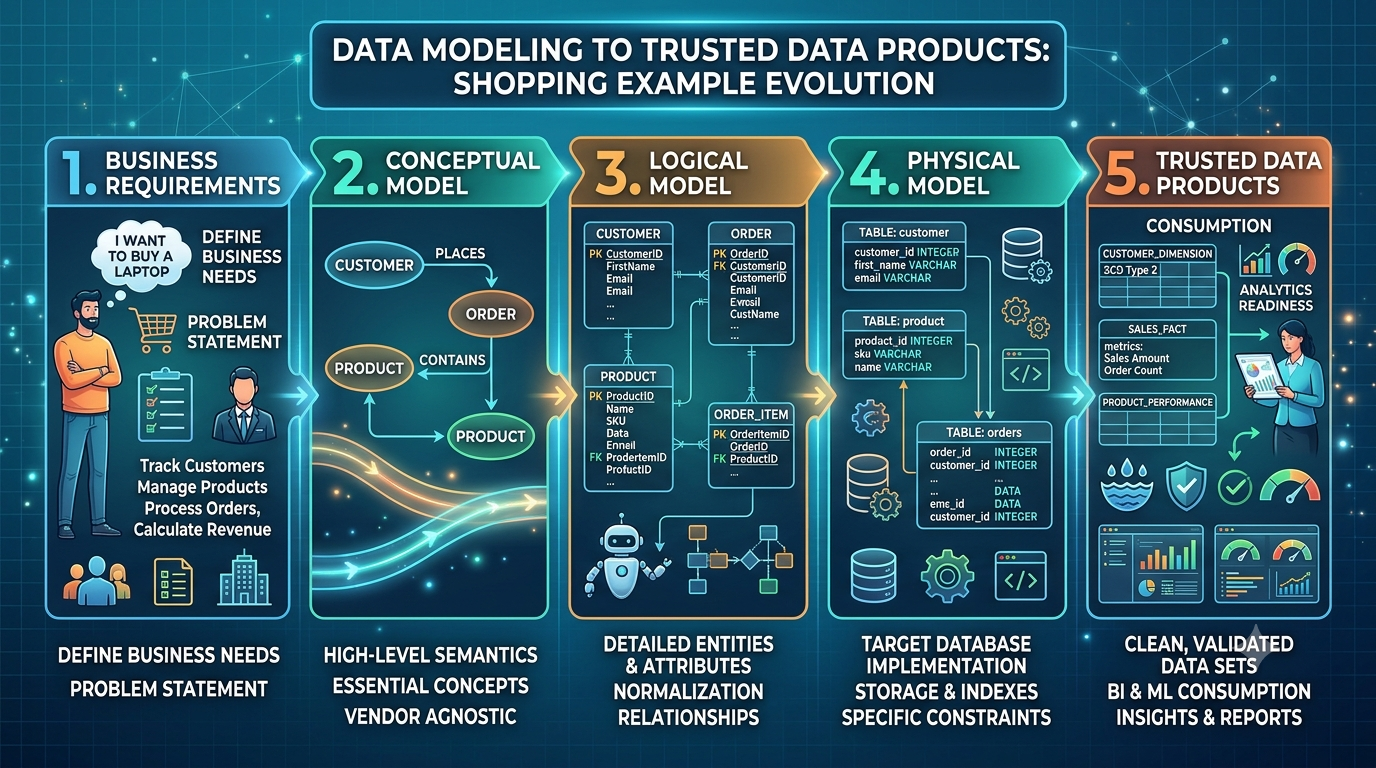
But data modeling usually happens at three levels:
Conceptual, Logical, and Physical.
Think of them as three different views of the same design.
3.1 Conceptual Data Model — What does the business care about?
At this stage, we are not worried about database types, indexes, or partitions.
We simply identify the important business entities and how they relate.
For our shopping platform, the conceptual model might contain:
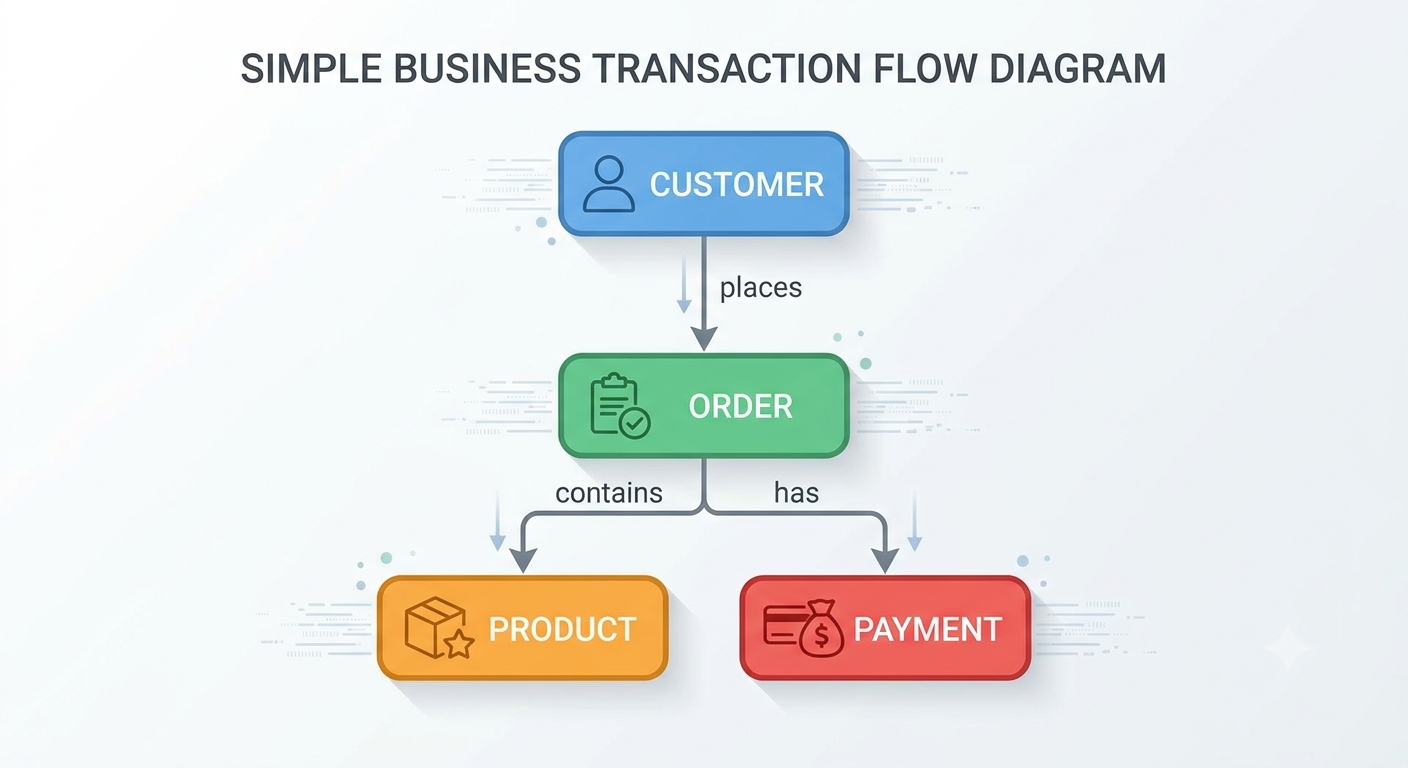
This is the business-level view.
It helps business stakeholders, architects, analysts, and engineers agree on what the system needs to represent.
We don't need to know whether customer_id is an INTEGER or a STRING yet.
We just need to agree that a customer exists, an order exists, and a customer can place multiple orders.
When to use it: During discovery, requirements gathering, domain discussions, and early architecture design.
Where it can fall short: It doesn't provide enough detail to implement the database. Developers still need attributes, keys, constraints, and storage decisions.
3.2 Logical Data Model — How are the business concepts structured?
Now we go one level deeper.
We identify attributes, primary keys, foreign keys, and relationships.
For example:
CUSTOMER
--------
customer_id (PK)
customer_name
email

ORDER
-----
order_id (PK)
customer_id (FK)
order_date
order_status
Here:
- PK means Primary Key.
- FK means Foreign Key.
A primary key uniquely identifies a record.
A foreign key connects one entity to another.
For example, customer_id in the ORDER entity tells us which customer placed that order.
At this stage, we are defining the logical structure without tying it to a specific database product.
When to use it: When translating business requirements into a consistent design, defining ownership, and reviewing relationships.
Where it can fall short: It does not yet describe all the implementation details required by a specific database engine.
3.3 Physical Data Model — How will we actually store it?
Now we get closer to implementation.
We decide the database, data types, indexes, partitions, clustering, constraints, and other storage-specific details.
For example:
CREATE TABLE customer (
    customer_id BIGINT NOT NULL,
    customer_name VARCHAR(200),
    email VARCHAR(255),
    created_at TIMESTAMP,
    PRIMARY KEY (customer_id)
);

CREATE TABLE orders (
    order_id BIGINT NOT NULL,
    customer_id BIGINT NOT NULL,
    order_date TIMESTAMP,
    order_status VARCHAR(50),
    PRIMARY KEY (order_id)
);
This is an illustrative relational database implementation. The exact syntax and enforcement of constraints depend on the database engine.
In a lakehouse, we might instead create Delta tables, choose partitioning or clustering strategies, define schema enforcement rules, and optimize for the expected query patterns.
The physical model is where performance and platform-specific considerations become important.
But remember: a beautifully optimized physical design cannot fix a fundamentally incorrect business model.
The difference at a glance
| Level | Main question | Example |
|---|---|---|
| Conceptual | What exists? | Customer, Order, Product |
| Logical | How are things related? | Customer ID, Order ID, relationships |
| Physical | How do we store it? | BIGINT, VARCHAR, Delta table, indexes |
4. The major types of Data Models
Now that we understand the levels, let's look at the different modeling approaches.
One important clarification before we continue:
Conceptual, logical, and physical describe levels of detail. Relational, dimensional, document, graph, and other approaches describe ways of organizing data.
They are related, but they are not the same classification.
And there is no single model that wins everywhere.
Let's understand why.
4.1 Relational Data Model — Keep information structured
This is one of the most widely used approaches.
Information is stored in tables containing rows and columns.
Each table represents an entity, and relationships connect the tables.
For example:
CUSTOMER
| customer_id | customer_name |
|---|---|
| 101 | Sarah |
| 102 | John |
ORDER
| order_id | customer_id | amount |
|---|---|---|
| 5001 | 101 | 1200 |
| 5002 | 102 | 800 |
| 5003 | 101 | 450 |
Sarah has two orders. John has one.
We can connect the tables using customer_id.
SELECT
    c.customer_name,
    o.order_id,
    o.amount
FROM customer c
JOIN orders o
    ON c.customer_id = o.customer_id;
The database joins the related records and gives us the result.
Advantages: Relational models provide clear structure, well-understood relationships, constraints, and strong transactional support in databases designed for it.
Disadvantages: Queries may require several joins. As the number of entities grows, the model can become harder to understand. Large analytical workloads may also benefit from a different layout.
When I would use it: Customer management, order processing, payment workflows, inventory systems, and other applications where structured records and transactional consistency matter.
When I would avoid using it as the only model: When the main workload involves large-scale analytical reporting with repeated joins across many normalized entities. I would usually create a separate analytical representation rather than force the operational model to serve every query.
4.2 Dimensional Data Model — Make analytics easier
Now imagine the business wants to answer questions like:
- What was our revenue last month?
- Which product category generated the most sales?
- Which region has the highest order volume?
- How does revenue compare year over year?
We could query the relational tables, but repeated joins can make analytical queries complicated.
This is where dimensional modeling becomes useful.
It organizes analytical data around facts and dimensions.
A fact represents something measurable that happened.
A dimension provides descriptive context.
For our shopping platform:
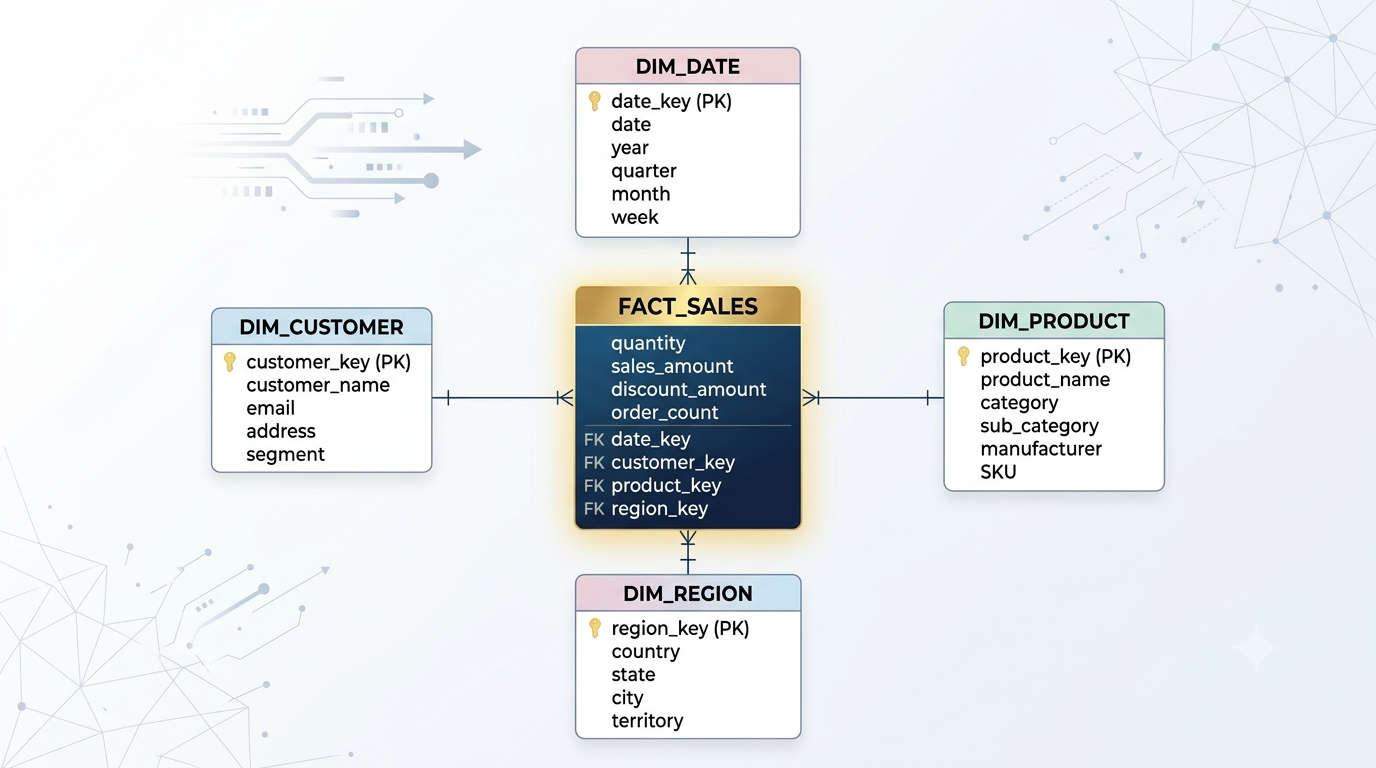
Fact table: fact_sales
| order_id | product_key | customer_key | quantity | sales_amount |
|---|---|---|---|---|
| 5001 | 10 | 101 | 1 | 1200 |
| 5002 | 20 | 102 | 2 | 800 |
| 5003 | 10 | 101 | 1 | 450 |
Dimension tables:
dim_customerdim_productdim_datedim_region
The fact table tells us what happened. The dimensions tell us who, what, when, and where.
A common dimensional design is the Star Schema.
The fact table sits in the middle, surrounded by dimension tables.
There is another common variation: the Snowflake Schema.
In a star schema, dimensions are often kept relatively denormalized for simpler analytical queries.
In a snowflake schema, dimensions are split into additional related tables.
For example:
DIM_PRODUCT
    |
    | product_category_id
    |
DIM_PRODUCT_CATEGORY
Instead of storing category details directly in every product dimension record, we maintain a separate category table.
Advantages of dimensional modeling: It makes business reporting easier to understand, supports reusable metrics, and can improve analytical query patterns.
Disadvantages: It requires careful design of fact-table grain, dimensions, and historical changes. Poorly designed joins can duplicate measures. It is also not automatically suitable as the authoritative source for operational transactions or financial accounting.
When I would use it: BI dashboards, business reporting, sales analytics, customer analytics, and curated Gold-layer datasets in a lakehouse.
When I would avoid using it as the only model: When the application needs to manage highly transactional workflows or preserve every operational state transition. A star schema is an analytical model, not a replacement for every operational system.
4.3 Document Data Model — Store flexible, nested information
Not every business object fits neatly into a fixed set of relational tables.
Imagine a product catalog.
A laptop has RAM, processor, and screen size. A mobile phone has storage, camera, and battery capacity. A book has an author, publisher, and ISBN.
Trying to force every product into exactly the same set of columns can become awkward.
A document model stores information as documents, often using JSON-like structures.
For example:
{
  "product_id": 101,
  "product_name": "Laptop",
  "category": "Electronics",
  "specifications": {
    "processor": "Intel i7",
    "ram": "16GB",
    "storage": "1TB SSD"
  }
}
Another product can have a different set of attributes.
This flexibility is useful when the structure varies by record.
Advantages: Flexible structures, natural representation of nested data, and convenient access to related information stored together.
Disadvantages: Duplicate information can appear across documents. Maintaining relationships and consistency across many documents can become difficult. Large nested structures can also become expensive to update or query.
When I would use it: Product catalogs, content management, application profiles, configuration data, and APIs that naturally exchange nested documents.
When I would avoid it: When the application depends heavily on complex joins, strict relational constraints, or frequent updates to shared information across many records.
4.4 Graph Data Model — Understand relationships
Now let's consider a different problem.
A customer buys a product.
That customer also follows another customer. Both customers purchased products from the same seller. One product is frequently bought with another product.
The business now wants to understand relationships:
- Which customers are connected?
- Which products are commonly purchased together?
- Can we identify suspicious transaction networks?
- What is the shortest relationship path between two entities?
A graph model represents data using:
- Nodes: entities such as customers, products, and sellers.
- Edges: relationships between those entities.
- Properties: additional information about nodes or relationships.
For example:
Customer A
    |
    | PURCHASED
    |
Product X
    |
    | SOLD_BY
    |
Seller B
This model makes relationships first-class citizens.
Advantages: Natural representation of connected data, relationship traversal, recommendation use cases, and network analysis.
Disadvantages: It introduces a different query and operational model. Large graph traversals can be resource-intensive, and graph databases may not be the best fit for ordinary tabular reporting.
When I would use it: Recommendation engines, fraud-ring analysis, identity relationships, knowledge graphs, and network topology.
When I would avoid it: When the workload is mostly straightforward aggregations, tabular reporting, or large-scale fact-table scans.
4.5 Key-Value Data Model — Find something quickly
Sometimes the application doesn't need complex relationships.
It simply needs to look up a value using a known key.
For example:
customer:101 → Sarah
customer:102 → John
customer:103 → David
The key identifies the record, and the value contains the associated data.
This is a simple model used by many caching and distributed storage systems.
Advantages: Simple access patterns, fast lookups, and often good horizontal scalability.
Disadvantages: Limited querying by attributes, fewer natural relationships, and more responsibility placed on application logic.
When I would use it: Caching, sessions, user preferences, lookup services, and short-lived application state.
When I would avoid it: When the business needs complex joins, flexible analytical queries, or rich relationships between entities.
4.6 Time-Series Data Model — Understand how values change over time
Consider an IoT platform that receives temperature readings from thousands of sensors.
A reading is not very useful without knowing when it occurred.
A typical record might look like:
sensor_id | reading_time       | temperature
------------------------------------------------
S101      | 10:00:00            | 25.4
S101      | 10:01:00            | 25.7
S101      | 10:02:00            | 26.1
The important dimensions here are time, the entity being measured, and the measurement itself.
Time-series systems and time-oriented table designs often support efficient ingestion, time-based filtering, retention, and aggregation.
Advantages: Useful for high-volume time-stamped measurements, trend analysis, monitoring, and time-window queries.
Disadvantages: Data retention, downsampling, late-arriving measurements, and high-cardinality dimensions require careful design. A time-series model is not automatically the right structure for every kind of business data.
When I would use it: IoT telemetry, application metrics, infrastructure monitoring, sensor data, and financial market observations.
When I would avoid it: When the primary problem is managing complex transactional entities or representing relationships that are not fundamentally time-oriented.
4.7 Data Vault Model — Preserve history and integrate sources
Now let's look at an approach that often appears in enterprise data warehouses.
Imagine a company acquiring another company.
Both organizations have customer systems. Both have different customer IDs, different schemas, and different definitions of customer status.
How do we integrate the information without losing where it came from?
Data Vault modeling is designed for enterprise data integration and historical tracking.
It commonly uses three building blocks:
Hubs represent core business keys, such as Customer, Product, or Order.
Links represent relationships between those business keys.
Satellites store descriptive attributes and their historical changes.
A simplified example:
HUB_CUSTOMER
------------
customer_key
customer_business_key

LINK_CUSTOMER_ORDER
-------------------
customer_key
order_key

SAT_CUSTOMER_DETAILS
--------------------
customer_key
customer_name
email
source_system
load_timestamp
This structure helps preserve source history and integrate data from multiple systems.
Advantages: Strong support for historical traceability, source integration, and evolving enterprise data environments.
Disadvantages: More tables, more joins, more implementation complexity, and a steeper learning curve for analytical consumers. It often needs additional transformation into dimensional models for easy reporting.
When I would use it: Large enterprise platforms integrating many source systems where auditability, historical preservation, and changing source structures are important.
When I would avoid it: Small analytical projects, simple reporting requirements, or teams that do not need its additional integration and historical capabilities.
5. So, which Data Model is the best?
Here is the answer that may disappoint anyone looking for a single winner:
There is no universally best data model.
The right model depends on the problem.
Let's compare them:
| Model | Best suited for | Main trade-off |
|---|---|---|
| Relational | Transactional applications | Joins and schema changes need care |
| Dimensional | Analytics and reporting | Requires clear grain and business definitions |
| Document | Flexible, nested records | Cross-document consistency |
| Graph | Highly connected data | Traversal and operational complexity |
| Key-value | Fast key-based lookups | Limited query flexibility |
| Time-series | Time-stamped measurements | Retention and time-oriented query design |
| Data Vault | Enterprise integration and history | More tables and transformation complexity |
A common architectural mistake is choosing a model because it is popular.
A team hears that a company is using a lakehouse, so it starts putting everything into Delta tables.
Another team hears that dimensional modeling is good for analytics, so it tries to represent every operational workflow as a star schema.
Neither decision is automatically correct.
Technology should follow the workload, not the other way around.
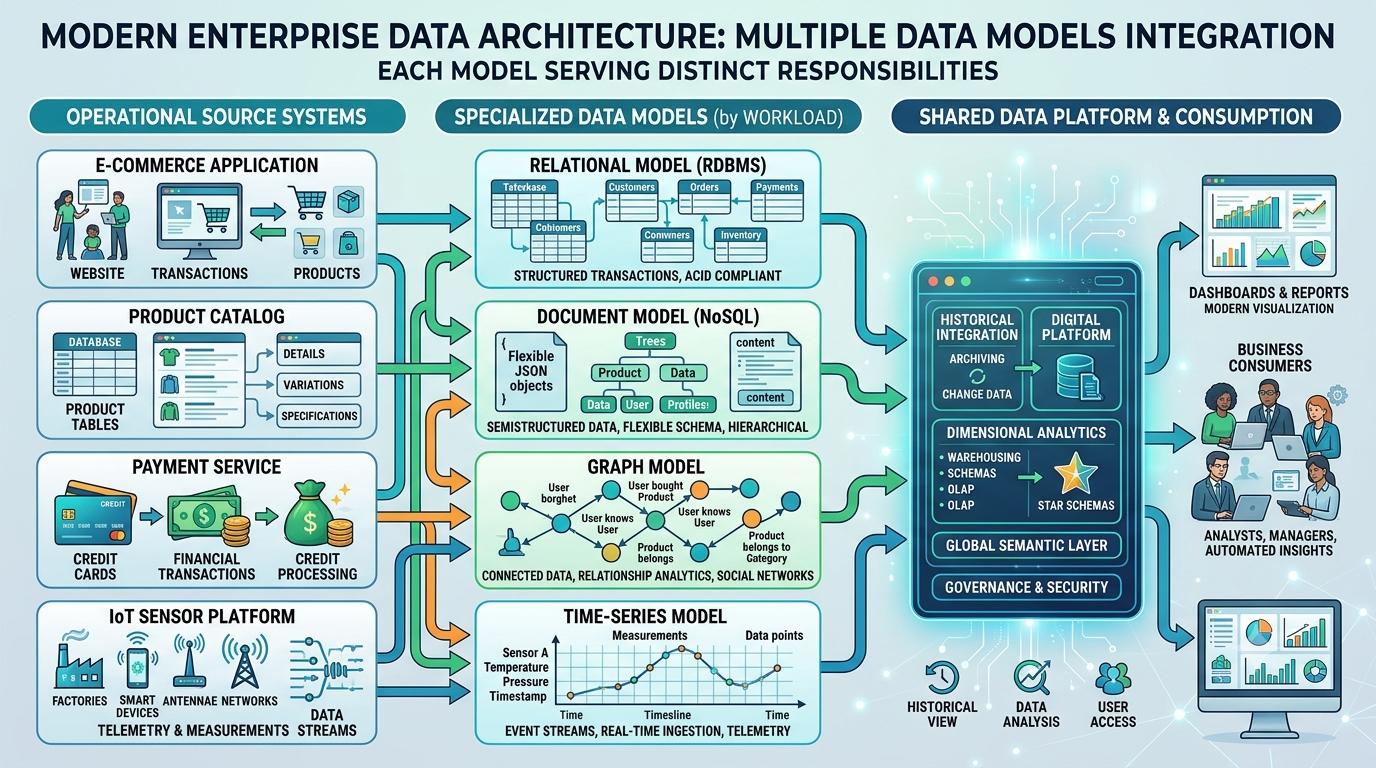
6. Can we use multiple Data Models together?
Absolutely.
In fact, this is often the more practical enterprise approach.
Let's return to our shopping platform.
The operational application needs to create orders and process payments. A relational model is a natural fit.
The product catalog may need flexible attributes. A document model may be useful there.
The recommendation engine may need to understand customer-product relationships. A graph model may help.
The analytics team needs to report revenue, order volume, and product performance. A dimensional model is useful.
The enterprise data platform may need to integrate years of information from multiple systems. Data Vault may be appropriate for that integration layer.
These models can coexist.
They are not necessarily competing with each other. They solve different problems.
A practical Lakehouse example
In a Databricks or Delta Lake environment, we might organize data into Bronze, Silver, and Gold layers.
Bronze: Preserve source data as received, with ingestion metadata and appropriate raw retention.
Silver: Apply validation, deduplication, standardization, and business rules. Create trusted entities and relationships.
Gold: Publish business-ready datasets, often using dimensional models or other purpose-built structures for reporting and consumption.
For example:
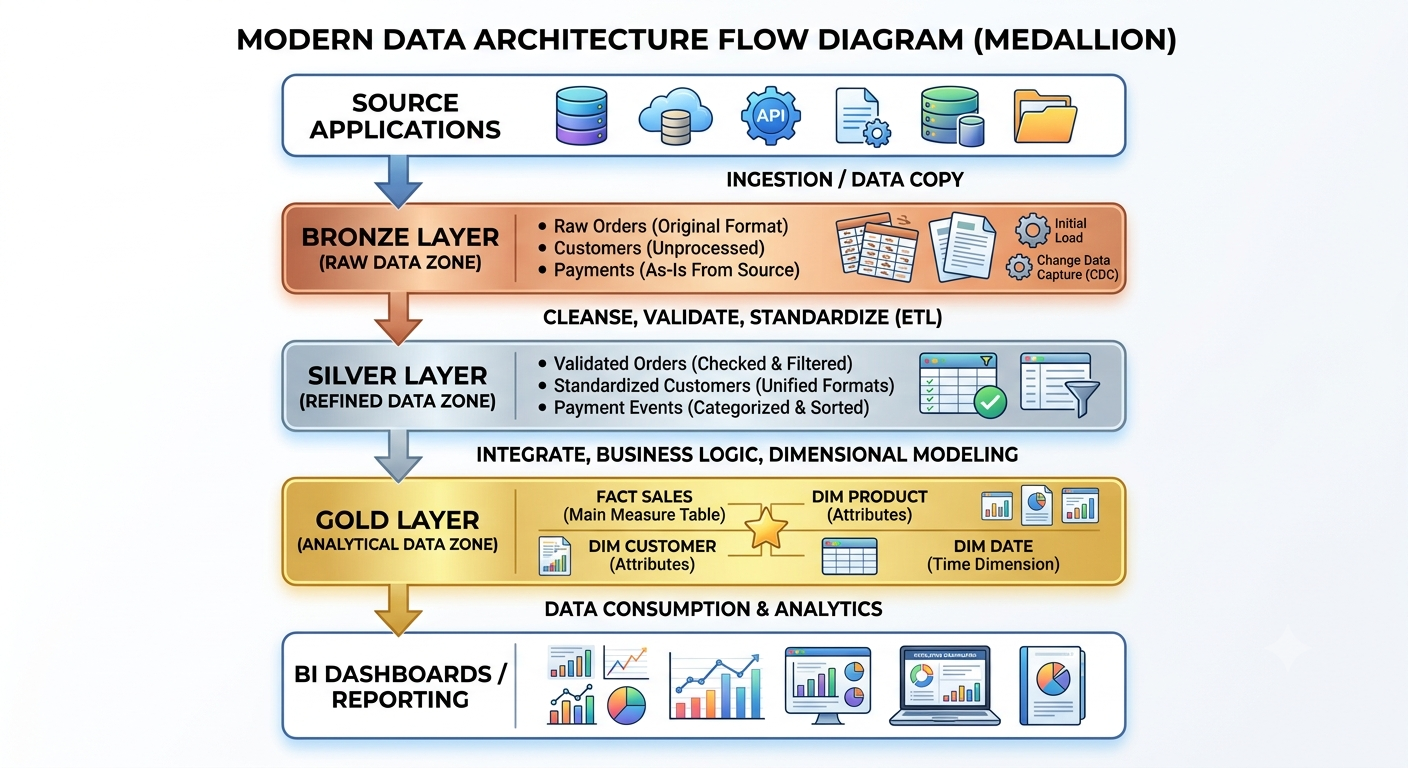
One important point: Bronze, Silver, and Gold are data-processing layers, not data-model types. A Bronze table can contain raw JSON, while a Gold table can use a dimensional model. The architecture and the modeling approach are related, but they describe different things.
That distinction is worth remembering.
7. The design decisions that separate a good model from a production-ready model
Now let's move beyond definitions.
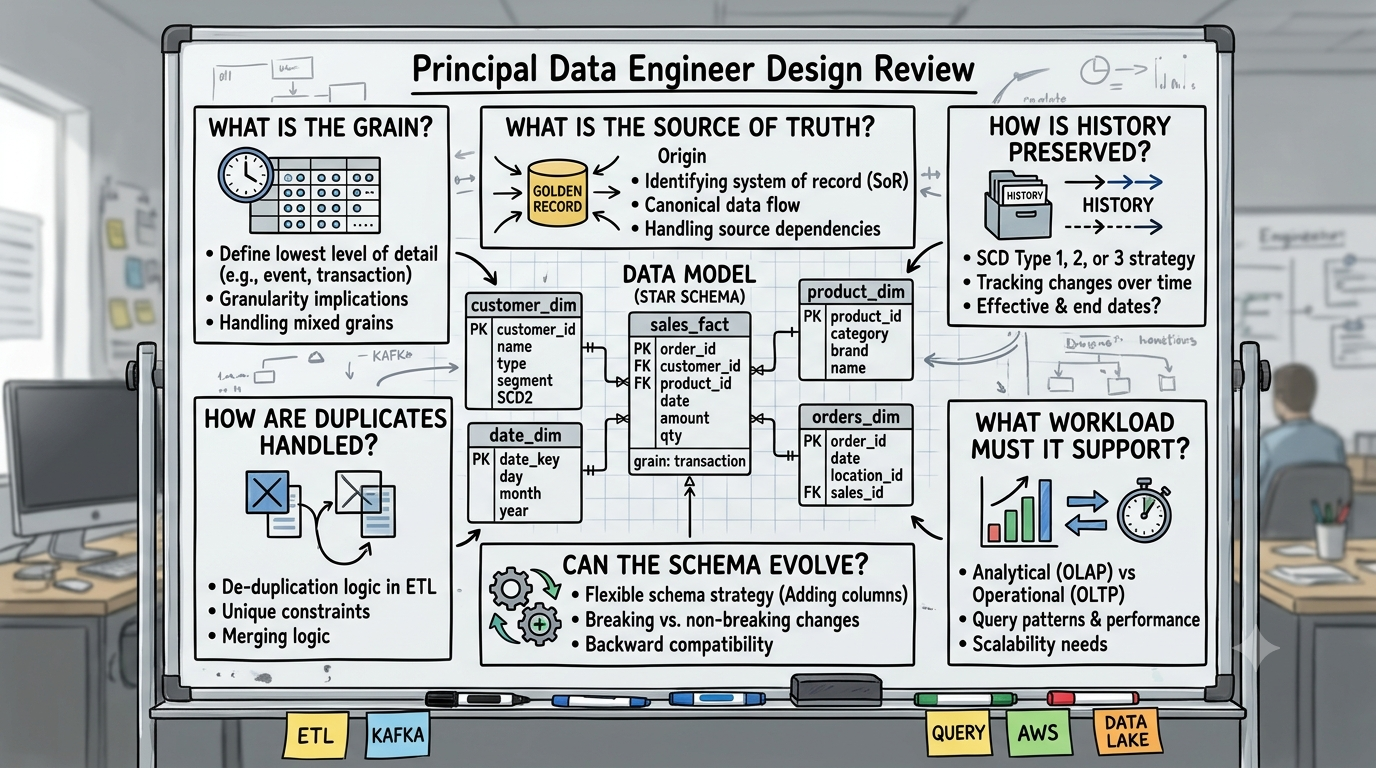
Knowing the different models is useful. Knowing what to challenge during a design review is where engineering judgment starts to matter.
Here are the questions I would want answered before approving a model.
7.1 What does one row actually represent?
This sounds obvious. It isn't.
Suppose we create a table called fact_sales.
Does one row represent:
- One order?
- One product inside an order?
- One payment?
- One shipment?
- One daily customer summary?
These are very different grains.
Imagine an order containing three products.
If the fact table has one row per product in the order, the order appears three times.
If we join that table to a payment table containing two payment attempts, the result could contain six rows.
Now imagine summing the order amount.
The report may multiply the revenue without anyone noticing.
SQL will not stop you. It will simply calculate what you asked it to calculate.
A Principal Engineer should insist that every fact table has a clearly documented grain.
7.2 What is the source of truth?
Suppose the customer address changes.
Should the historical orders show the customer's new address or the address used when the order was placed?
There isn't one answer for every business.
The model must make the intended behavior explicit.
For some applications, the current customer address is enough.
For order history, we may need an order-specific shipping address snapshot.
For historical customer analysis, we may need a Slowly Changing Dimension (SCD), such as Type 2, to preserve changes over time.
A design should explain which system owns each important business fact.
7.3 How do we handle history?
A table that only stores the latest value cannot always explain what happened in the past.
Consider this:
customer_id | customer_city
---------------------------
101         | Seattle
Sarah moves from Seattle to New York.
If we overwrite the city, the previous value disappears.
That might be perfectly acceptable for a current customer profile.
But what if the business wants to know how many customers lived in Seattle last year?
We need a historical strategy.
Depending on the requirement, that might involve SCD Type 2, event history, snapshots, or valid-time and recorded-time tracking.
Do not add historical complexity everywhere. Add it where the business needs it.
7.4 What happens when data arrives twice?
A payment event might be delivered again because of a retry.
If our model treats every received message as a new payment, we could count the same business event twice.
Stable business identifiers, idempotent processing, deduplication rules, and reconciliation are important.
And remember: a duplicate message and a duplicate business transaction are not always the same thing.
The model must define what makes a record unique.
7.5 Can the model evolve?
Businesses change.
A product gets new attributes. A payment provider introduces another status. A new region is added. A source system is replaced.
A model should support controlled change without silently changing the meaning of existing fields.
For example, changing order_amount from "amount before discount" to "amount after discount" without changing the contract is not a harmless schema change.
The column still exists. The data type is still correct. But the meaning has changed.
That is a much more dangerous problem.
7.6 Are we designing for the actual workload?
A model that works beautifully for a small dataset may struggle at enterprise scale.
Ask how the data will be read and written.
Will queries filter by date? Will users frequently join customer and order data? Will the system process millions of events per hour? Does the workload require low-latency lookups or large analytical scans?
These answers influence indexing, partitioning, clustering, file layout, materialization, and storage choices.
But don't optimize based on guesses.
Understand the workload first. Measure it. Then make the physical design decisions.
8. Common Data Modeling mistakes
A few mistakes appear repeatedly in data platform designs.
Mistake 1: Designing tables before understanding the business.
This often creates columns whose meaning nobody can explain consistently.
Mistake 2: Using one giant table for every use case.
It may look convenient at first. Over time, it becomes difficult to maintain, govern, and query correctly.
Mistake 3: Ignoring grain.
This is one of the easiest ways to introduce incorrect aggregations.
Mistake 4: Treating current state as complete history.
Overwriting a value may be fine for one use case and disastrous for another.
Mistake 5: Assuming denormalization is always faster.
It can improve read performance, but it also creates duplication and consistency responsibilities.
Mistake 6: Choosing a model because a tool supports it.
A database feature is not an architectural requirement.
And perhaps the biggest mistake:
Treating data modeling as a one-time database design exercise.
A model is a living representation of the business. It needs ownership, documentation, testing, versioning, and change management.
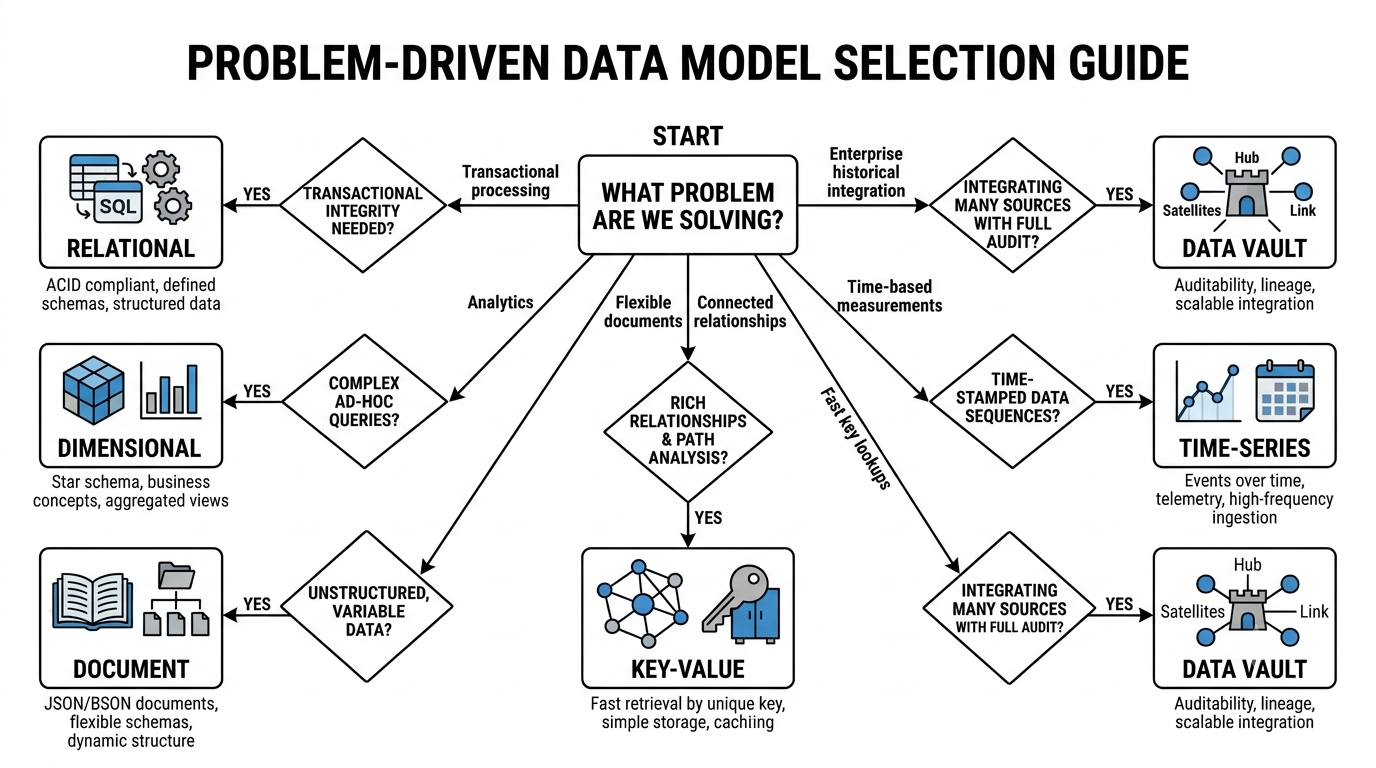
9. When should you use which model?
Let's make the decision practical.
Imagine you are reviewing a new platform design.
The team wants to build a customer-facing application, an analytics platform, a recommendation engine, and an IoT monitoring service.
You would not automatically choose one model for all four.
You would start with the access patterns and business requirements.
| Requirement | Model to consider |
|---|---|
| Create and update customer orders | Relational |
| Analyze revenue and product sales | Dimensional |
| Store flexible product attributes | Document |
| Find relationships between customers | Graph |
| Cache customer session information | Key-value |
| Analyze sensor readings over time | Time-series |
| Integrate historical data from many enterprise systems | Data Vault |
These are starting points, not mandatory rules.
A relational database can support analytical workloads at certain scales. A lakehouse can store relationally structured data. A graph workload can also be represented in tables, although the queries may become less natural.
The important thing is to understand the trade-offs rather than follow a fixed recipe.
10. The Principal Engineer perspective: Design for the business, not the diagram
At the beginning of this article, we had a shopping platform with conflicting revenue numbers.
Let's return to that problem.
The Sales team, Finance team, and Product team were asking different questions.
The mistake would be to assume that they all need the same table.
Instead, we should first agree on the meaning of revenue, order, payment, refund, and customer.
Then we design the models that support those definitions.
The operational system may use normalized entities. The analytical platform may use fact and dimension tables. Payment events may be preserved for traceability. Historical customer changes may be maintained through SCD Type 2.
Each model has a purpose.
The job of an Engineer is not to make the architecture look complicated or introduce every modeling pattern available.
It is to make sure that the design is correct, understandable, scalable, and maintainable for the business requirements.
Sometimes the right solution is a sophisticated hybrid architecture.
Sometimes it is three well-designed tables.
Both can be good engineering.
The difference is whether the design solves the actual problem.
Final thoughts
Data modeling is not about deciding how many tables to create. It is about deciding how the business should be represented in data.
The tables, columns, relationships, keys, partitions, and indexes come later.
Start by understanding the business. Identify the entities. Define the relationships. Be clear about history, uniqueness, and ownership. Then choose a modeling approach that fits the workload.
And please, before creating a table called
customer_final_v2_new, take a step back and ask whether the model itself needs another look.Your future self — and the person on call at 2 AM — will appreciate it.
#DataEngineering #DataModeling #DataArchitecture #Databricks #DataPlatform #PrincipalEngineer
About the author
- I am a Lead Data Infrastructure Architect with 13+ years of experience engineering high-throughput data platforms for fintech and consumer apps. I specialize in the Databricks Lakehouse ecosystem, PySpark, BigQuery, and Snowflake. I write about modern data architecture, cloud cost optimization (FinOps), declarative ELT pipelines, and scaling systems to process 100K+ events per second. When I'm not untangling complex legacy databases, I'm building zero-loss data quality frameworks.
Comments
Join the discussionNo comments yet. Be the first to comment.