Crypto Finance Data Modeling: A Staff Engineer's Field Guide
Your data model isn't just a way to organize tables. In a financial system, it is part of how you prove what happened to someone's money. A badly designed model can make a successful trade look like a failed one, turn a refund into revenue, double-count trading volume, or report a wallet balance that never actually existed. And the most dangerous part? The dashboard can still look beautiful. I've seen teams spend weeks optimizing Spark jobs, partitioning Delta tables, tuning joins, and reducing query latency. All useful work. But before touching any of that, there's a more fundamental question worth asking: Are we even representing the business correctly? Because a query that returns the wrong answer in 200 milliseconds is not an optimization. It's a faster way to lose trust. Let's take a practical look at data modeling through the lens of a crypto trading platform. We'll examine the business requirements, the modeling choices, the architecture, the trade-offs, and the decisions a Staff Engineer should be making before the first production table is created.
1. The uncomfortable truth: Data Modeling is a business decision
Imagine we're building a crypto exchange called OrbitX.
A customer deposits ₹100,000, buys Bitcoin, places a limit order, partially fills it, cancels the remaining quantity, pays a trading fee, and later sells some of the Bitcoin.
Now three teams ask questions about the same customer.
Finance: How much money does OrbitX owe this customer?
Product: How many trades did the customer execute this week?
Risk: How much exposure does the customer currently have?
Operations: Which transactions are still pending?
Leadership: How much trading revenue did we generate today?
All five questions concern the same business. Yet they do not necessarily need the same data model.
Finance needs a defensible accounting record. Product needs a consistent definition of activity. Risk needs a timely view of exposure. Operations needs state transitions and failure visibility. Leadership needs aggregated metrics with agreed definitions.
If we build one giant table to answer everything, we might get something like this:
customer_id, order_id, trade_id, deposit_amount, trade_price, fee, balance, status, timestamp
It looks convenient. It also hides a pile of assumptions.
Which timestamp? Order creation or trade execution?
Does balance mean available balance or total balance?
Does fee mean estimated fee, charged fee, or fee after a refund?
If an order fills three times, do we store three rows or overwrite one row?
If a trade is corrected, do we update the original record or preserve the correction?
These are not merely column-design questions. They're business semantics, accounting rules, and audit requirements hiding inside a database schema.
Staff Engineer takeaway: Start with the decisions the data must support and the invariants the system must preserve. Choose the model after that.
2. What is Data Modeling, really?
Data modeling is the process of defining how business entities, events, relationships, rules, and measures are represented so that operational systems and analytical consumers can use the data consistently.
In a financial system, a good model must answer four questions:
Identity: What exactly is this thing? An order, a trade, a transfer, or a ledger entry?
State: What is true about it right now, and how did it get there?
History: What happened, when did it happen, and can we reconstruct the past?
Meaning: What does a number represent, and what rules govern its calculation?
These questions lead to a critical distinction.
An order is not a trade. A trade is not a settlement. A settlement is not a ledger entry. A ledger entry is not a wallet balance.
They are related, but they represent different business concepts.
When we collapse them into one entity because the first dashboard needs only five columns, we create coupling that becomes expensive later.
And later usually arrives on a Friday evening.
3. Our crypto exchange: follow the money
Let's follow a realistic example.
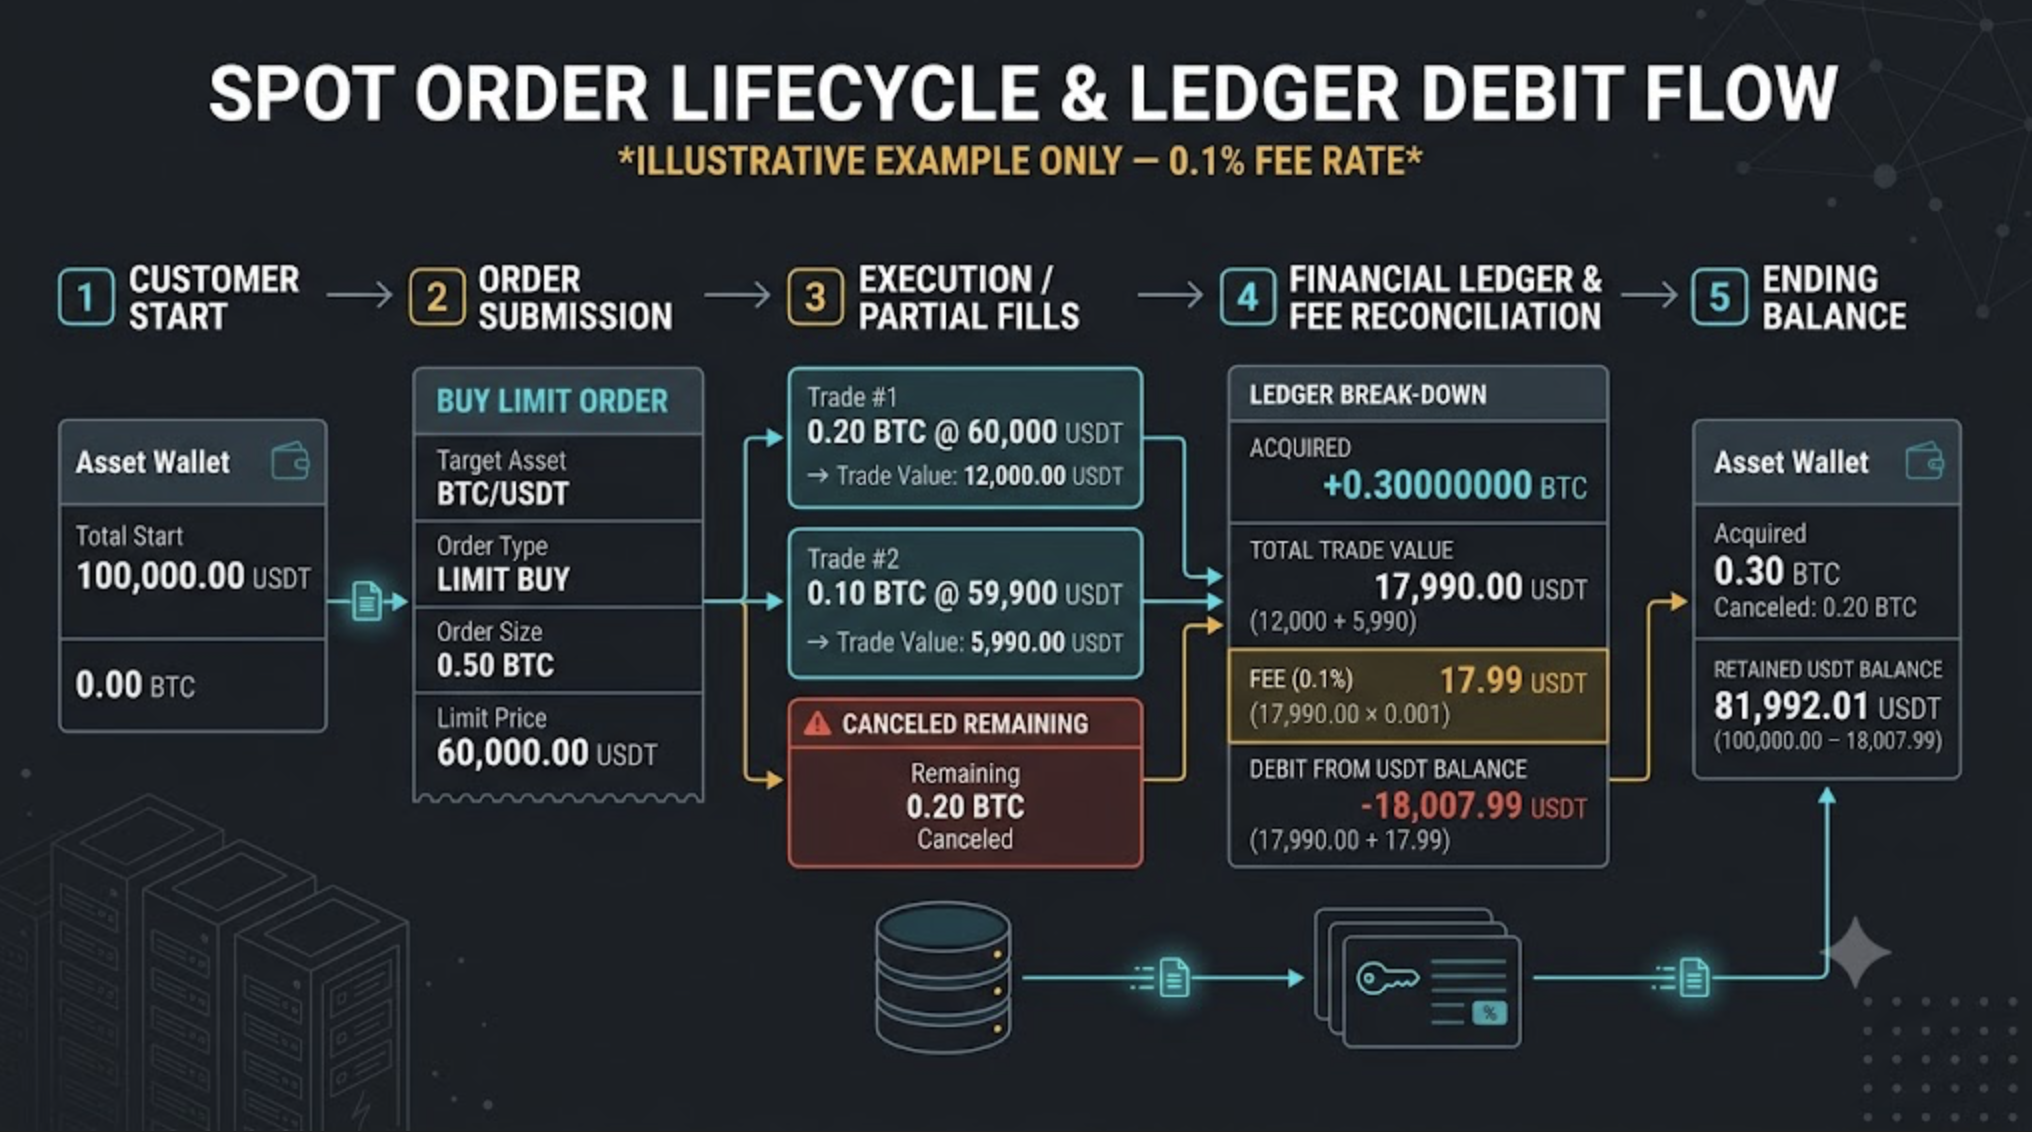
A customer has 100,000 USDT in their exchange account and places an order to buy BTC.
The order requests 0.5 BTC at 60,000 USDT per BTC.
The order's maximum notional value is:
$$0.5 \times 60,000 = 30,000 \text{ USDT}$$
Assume the order is partially filled:
| Execution | BTC filled | Price | Trade value |
|---|---|---|---|
| Trade A | 0.2 BTC | 60,000 USDT | 12,000 USDT |
| Trade B | 0.1 BTC | 59,900 USDT | 5,990 USDT |
| Total filled | 0.3 BTC | — | 17,990 USDT |
The remaining 0.2 BTC is canceled.
For illustration, assume the buyer pays a 0.1% fee in USDT on each fill.
Trade A fee: 12 USDT
Trade B fee: 5.99 USDT
Total fee: 17.99 USDT
The total amount debited for the two fills is 18,007.99 USDT, assuming no other charges and that fees are charged in USDT.
The customer's resulting USDT balance is:
$$[ 100{,}000 - 18{,}007.99 = 81{,}992.01 ]$$
The customer now holds 0.3 BTC from these executions.
Notice what we've just established:
The order requested 0.5 BTC.
Only 0.3 BTC was executed.
Two trades occurred.
The unfilled quantity was canceled.
The customer acquired BTC and paid USDT plus fees.
The customer's asset balances changed.
The exchange may have recognized fee revenue, subject to its accounting policy and the actual fee postings.
One business workflow. Multiple facts. Multiple state transitions. Different reporting requirements.
If the data model cannot represent these distinctions, no amount of SQL cleverness will rescue it.
4. The modeling approaches: there is no universal winner
Let's look at the major approaches and what they are actually good at.
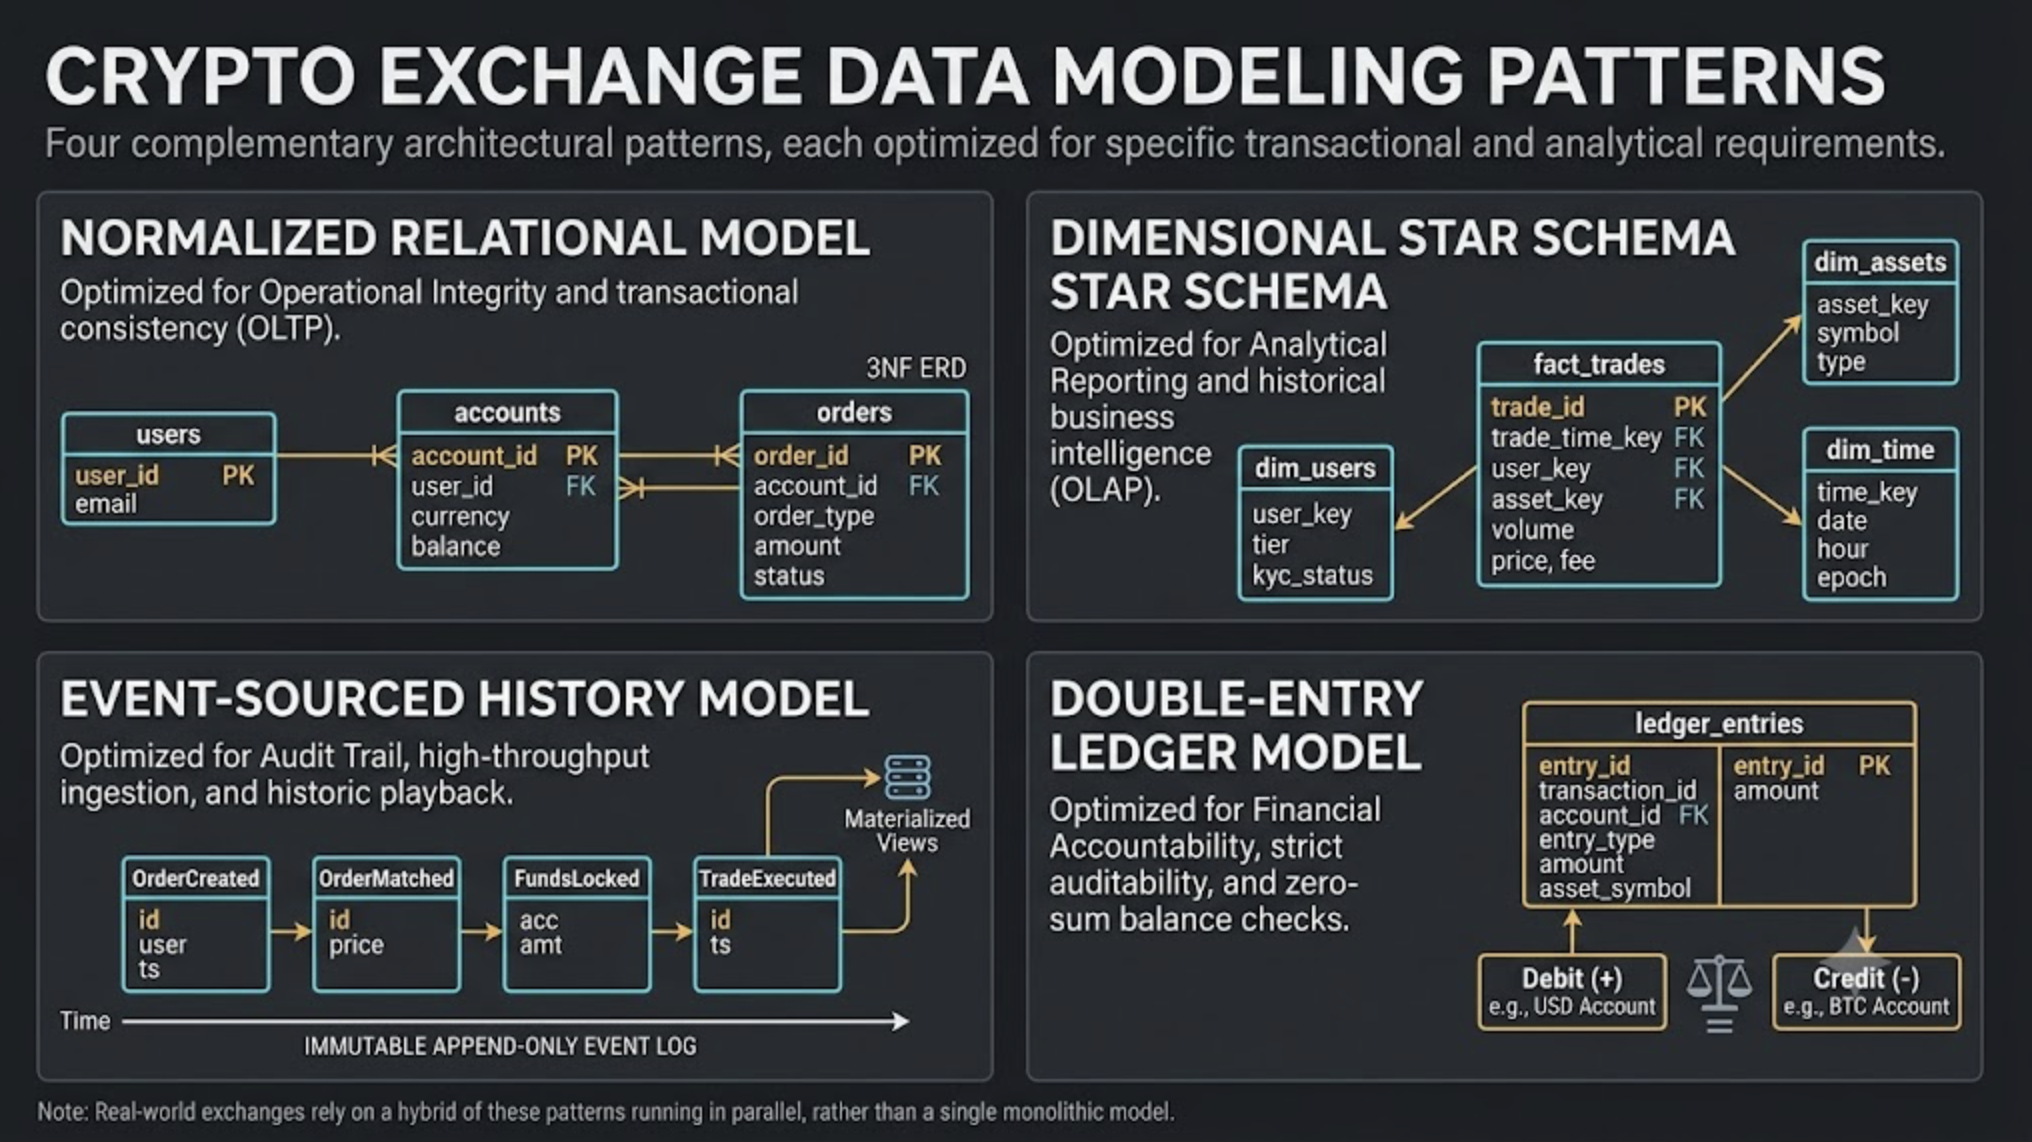
4.1 Normalized relational modeling: protect operational truth
Normalization organizes data into related entities and reduces unnecessary duplication.
An operational schema might contain:
customersaccountsorderstradesassetsorder_status_historytransfers
An order belongs to an account. A trade references the order or orders involved, depending on the matching engine's domain model. An asset identifies BTC, USDT, or another supported asset.
The key benefit is that each entity has a clear identity and responsibility.
For example, the order table might store:
| Column | Meaning |
|---|---|
order_id |
Unique order identifier |
account_id |
Account placing the order |
base_asset |
BTC |
quote_asset |
USDT |
side |
BUY |
order_type |
LIMIT |
requested_quantity |
0.5 BTC |
limit_price |
60,000 USDT/BTC |
created_at |
Order creation time |
The trade table stores executions, not the original order request.
| Column | Meaning |
|---|---|
trade_id |
Unique execution identifier |
order_id |
Associated order |
executed_quantity |
Quantity actually filled |
execution_price |
Actual execution price |
executed_at |
Execution time |
The order can remain partially filled even though several trade records exist.
Where normalization shines: operational correctness, entity integrity, controlled updates, and transactional workflows.
Where it becomes inconvenient: analytical queries may need several joins, and repeatedly joining large normalized tables can be expensive or cumbersome.
The answer is not to abandon normalization. It's to recognize that an operational model and an analytical model solve different problems.
4.2 Dimensional modeling: make business questions easier to answer
Dimensional modeling organizes analytical data around measurable business processes and descriptive dimensions.
A common structure is a star schema.
For our exchange, a fact_trade_execution table could contain:
trade_id
order_id
account_key
asset_pair_key
execution_time_key
executed_quantity
execution_price
trade_notional
fee_amount
fee_asset_key
Supporting dimensions might include:
dim_accountdim_assetdim_asset_pairdim_timedim_market
This makes questions such as the following straightforward:
What was BTC/USDT trading volume yesterday?
How much fee was charged by market?
Which customer segments generated the most trade activity?
How did execution volume change by hour?
But here's the trap: a fact table is only correct if its grain is correct.
The grain defines exactly what one row represents.
For fact_trade_execution, our grain might be:
One row per uniquely identified executed trade.
Not one row per order. Not one row per customer per day. Not one row per trade after joining every associated status event.
If one order produces ten executions, the trade fact should represent ten executions.
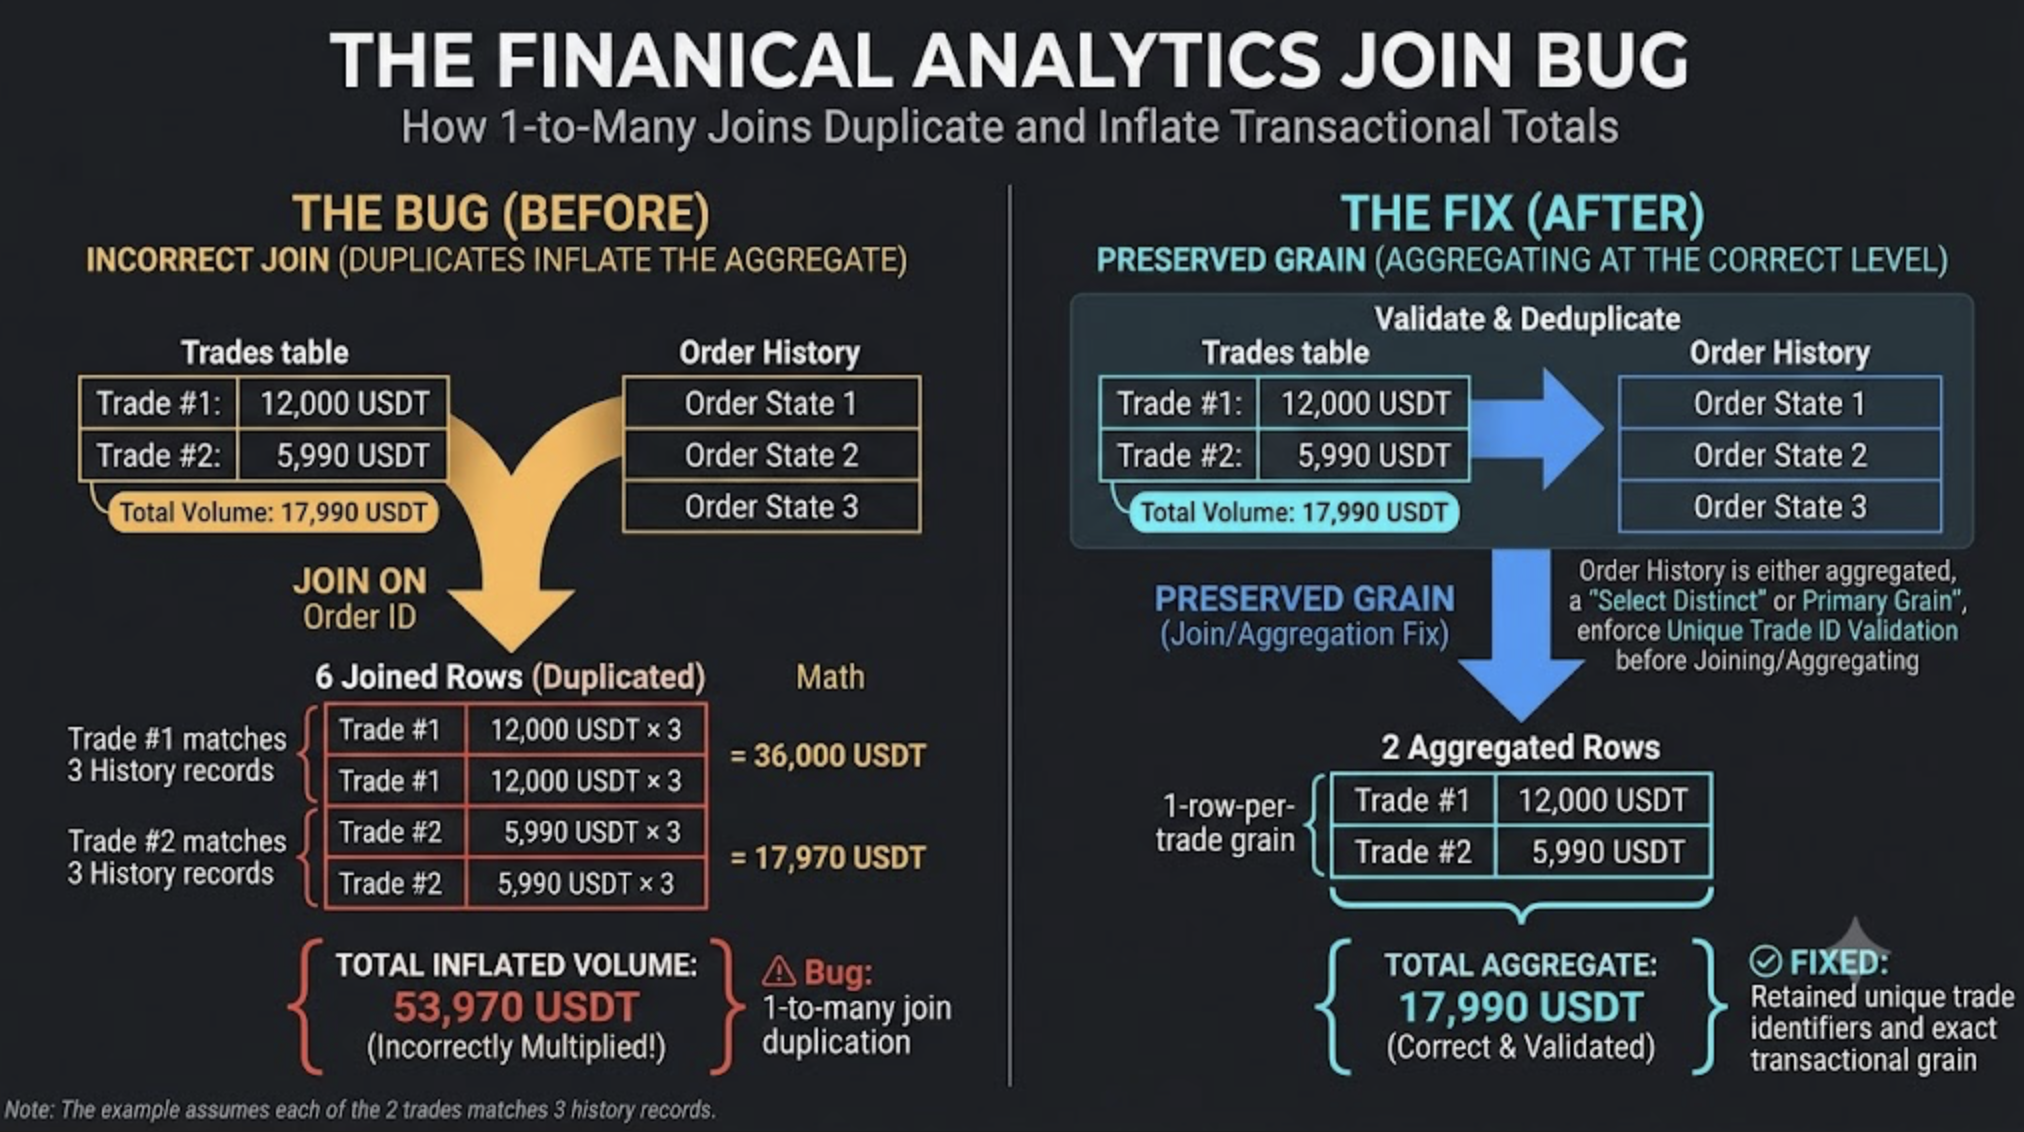
If we accidentally join each trade to three order-status events, those ten executions might become thirty rows. Our volume could triple without any exception being raised.
The dashboard would happily present the result. SQL has no built-in sense of embarrassment.
Where dimensional modeling shines: reporting, analytics, dashboards, business metrics, and predictable query patterns.
Where it falls short: it is not a substitute for an authoritative accounting ledger, and it does not automatically solve event history, reversals, or operational consistency.
4.3 Event modeling: preserve what happened
A trading platform is not simply a collection of current-state records. It is a sequence of events.
An order might move through:
CREATED → ACCEPTED → PARTIALLY_FILLED → CANCELED
The exact lifecycle depends on the exchange's rules. Other paths may include rejection, full fill, expiration, or replacement.
An event-oriented model preserves transitions such as:
OrderAccepted
TradeExecuted
OrderPartiallyFilled
OrderCanceled
FeeCharged
DepositCredited
Each event should have a stable event identifier, business entity identifiers, an event type, a business-effective timestamp, a recording timestamp, and an appropriate schema version.
A simple event record could look like:
{
  "event_id": "evt-90021",
  "event_type": "TradeExecuted",
  "trade_id": "trade-701",
  "order_id": "order-501",
  "account_id": "acct-88",
  "base_asset": "BTC",
  "quote_asset": "USDT",
  "executed_quantity": "0.2",
  "execution_price": "60000",
  "event_time": "2026-10-19T10:15:20.123Z",
  "recorded_at": "2026-10-19T10:15:20.140Z",
  "schema_version": 1
}
This is illustrative rather than a complete exchange event contract. Production contracts should explicitly define decimal precision, units, optional fields, event ordering, and compatibility rules.
Events are valuable because they let us investigate how a state was reached rather than seeing only the final state.
But event streams bring their own responsibilities:
Events can be delivered more than once.
Consumers can process them out of order.
Schemas evolve.
Events may arrive late.
Replaying an event stream must not accidentally repeat a financial effect.
An event log is not automatically an accounting ledger. It records business occurrences; accounting entries represent the financial effects under a defined accounting model.
Where event modeling shines: traceability, state reconstruction, integration, replay, and asynchronous workflows.
Where it becomes difficult: projections, ordering, schema evolution, replay safety, and keeping derived state consistent.
4.4 Ledger modeling: money needs stronger rules
Now we reach the model that deserves special attention in finance.
A financial ledger records postings that explain movements in value. For an exchange, a customer-facing balance should be explainable from the relevant posted entries, subject to the account model and any explicitly modeled holds or pending transactions.
A simplified double-entry example for our BTC purchase might be:
| Account | Asset | Debit | Credit |
|---|---|---|---|
| Customer USDT liability | USDT | 18,007.99 | — |
| Exchange USDT clearing/custody | USDT | — | 17,990.00 |
| Exchange fee revenue | USDT | — | 17.99 |
This table illustrates one possible accounting representation, not a universal journal-entry recipe. The actual accounts, debit/credit conventions, custody treatment, and recognition rules must be defined by Finance. A real implementation must also reconcile the exchange's customer liabilities with assets held or controlled by the exchange.
The important principle is that every posting belongs to a defined accounting transaction, and the entries must balance within the appropriate accounting unit and rules.
For a double-entry journal, debits and credits balance for the relevant transaction and accounting currency or ledger unit. A BTC quantity and a USDT amount cannot simply be added together because both happen to be numbers.
A practical ledger design usually needs:
An immutable posting identity.
A transaction or journal identifier.
Account and asset identifiers.
Debit/credit or signed-amount conventions.
Exact decimal representation.
Posting status and effective time.
References to the originating business event.
Reversal or adjustment relationships.
Idempotency controls.
Reconciliation and audit metadata.
Do not casually update a posted financial entry to make a report look right. Corrections should follow an explicit, auditable reversal or adjustment process appropriate to the accounting policy.
A ledger model is powerful because it provides a defensible record of financial effects.
It is also more demanding than an ordinary analytical table. The system needs clear transaction boundaries, duplicate protection, reconciliation, access controls, and carefully defined posting rules.
5. The real answer: Use a Hybrid Model
Here's my preferred architectural position for a serious crypto exchange:
Do not force one model to serve every workload. Give each model a clear job, and connect them through stable business identifiers and well-defined contracts.
Use normalized operational models for transactional entities. Use event streams for business transitions. Use ledger postings for financial effects. Use dimensional models for analytical consumption.
These are not competing religions. They're complementary tools.
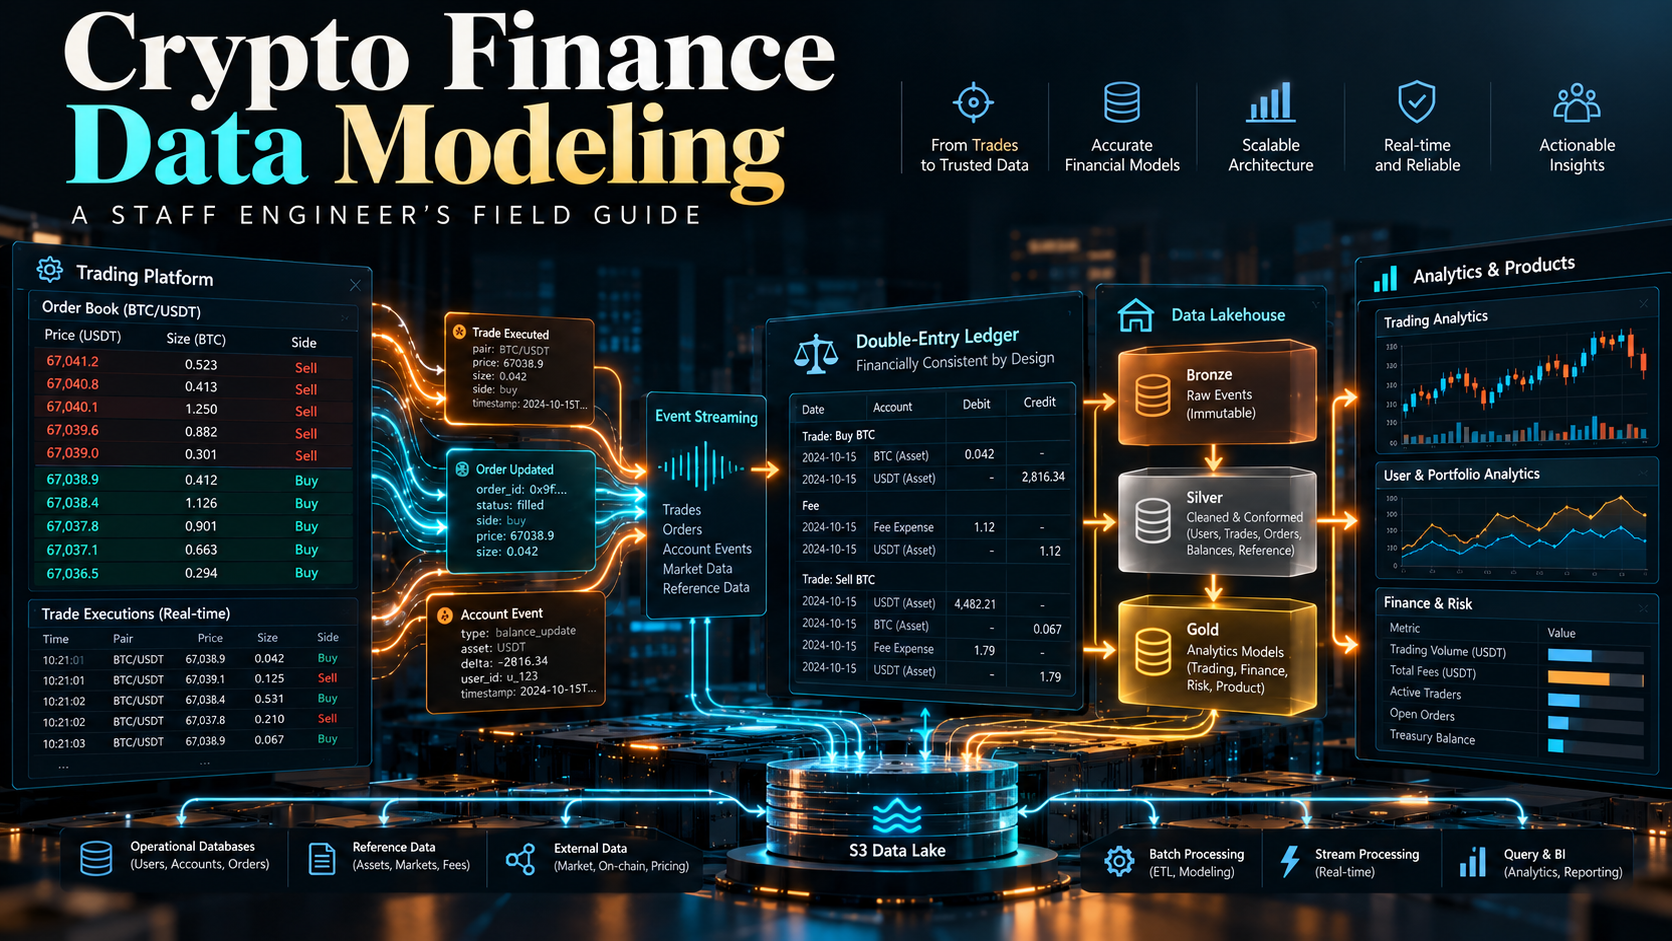
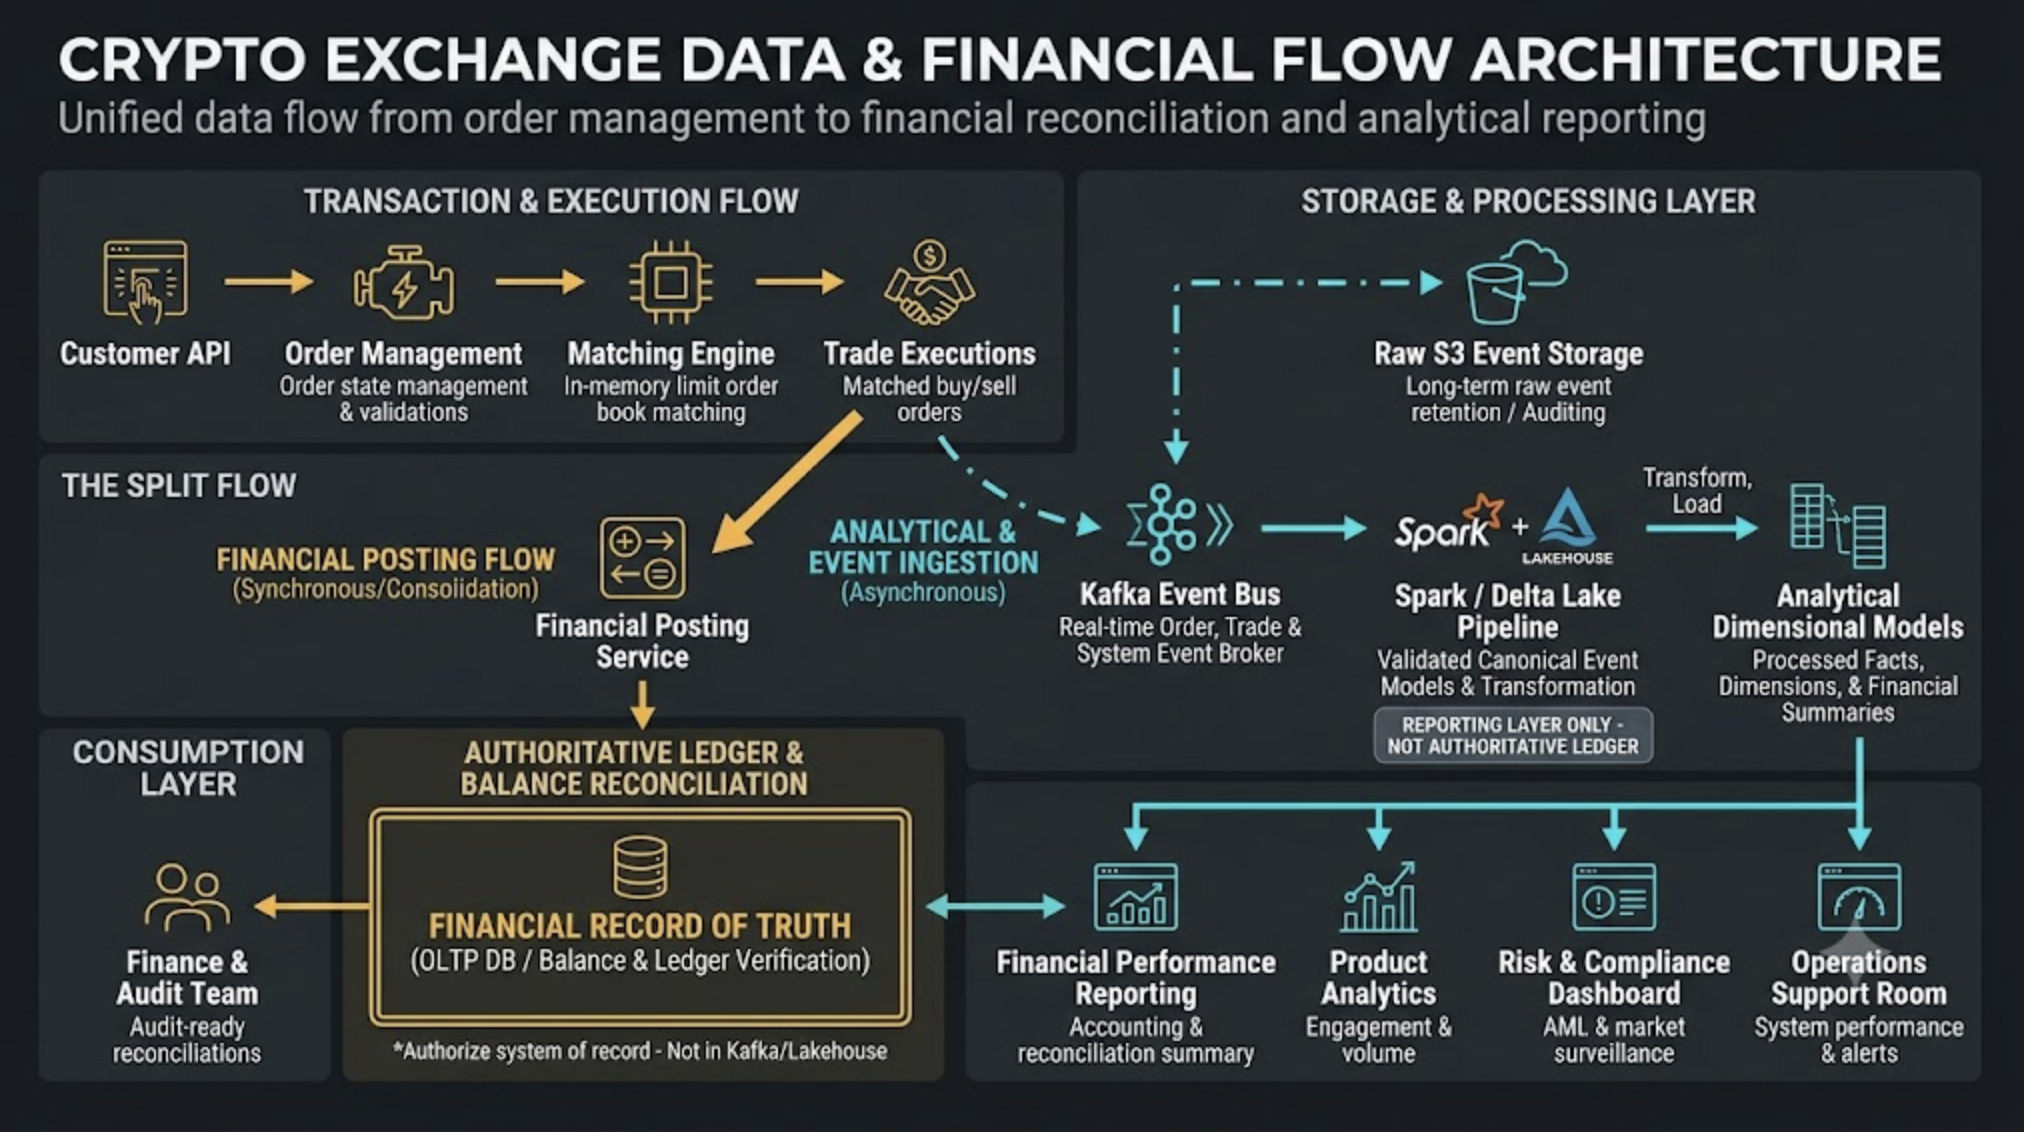
Architecture diagram: from trade to trusted reporting
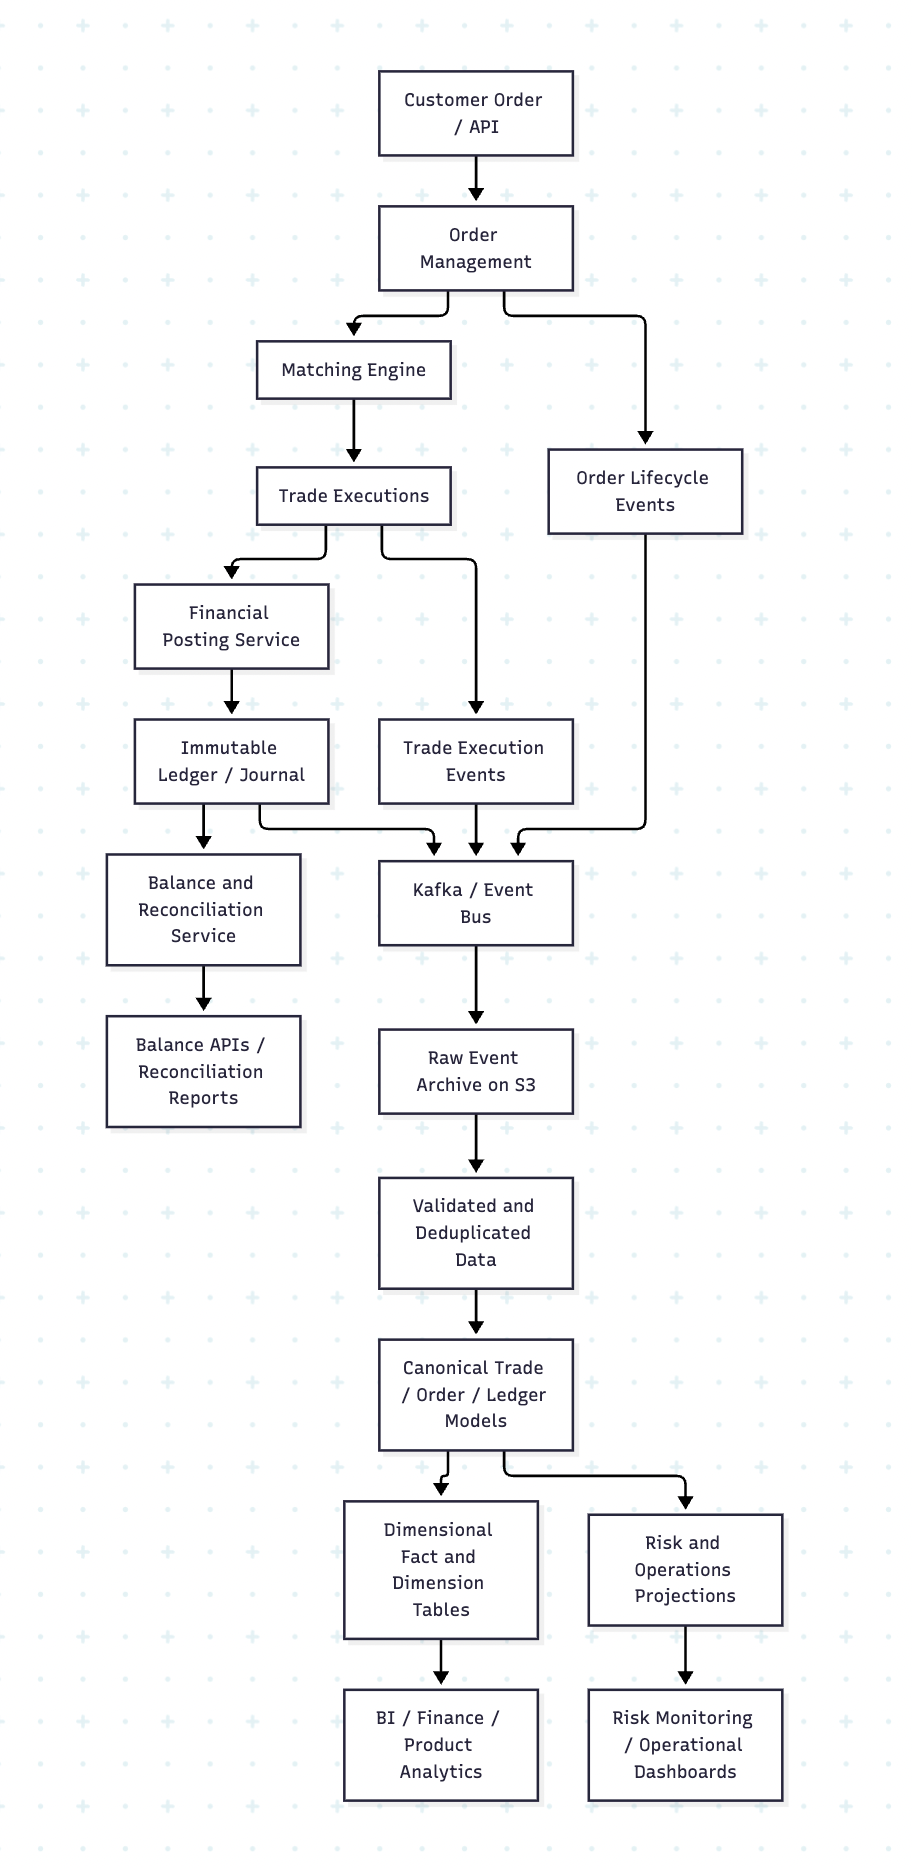
The diagram shows logical responsibilities, not a requirement to deploy every box as a separate micro-service. Depending on scale, regulation, and team boundaries, some components may be combined.
What happens at each stage?
1. Order management
The exchange accepts and validates the order. The operational model records the order's identity, parameters, and lifecycle state.
An order is not yet proof that a trade occurred.
2. Matching and execution
The matching engine produces execution records. Each execution has a stable identity, quantity, price, and execution time.
A single order can produce multiple executions, which is why order and trade must remain distinct entities.
3. Financial posting
The financial posting process translates business events into the appropriate ledger entries.
This is where duplicate protection, accounting rules, asset precision, and transaction integrity become essential.
The posting service should have a clearly defined contract for whether an event is eligible for posting and how retries are handled.
4. Event distribution and raw retention
Events flow through a messaging layer such as Kafka, while raw event payloads can be retained in S3 for replay and investigation, subject to retention and security requirements.
Kafka is a transport and streaming platform. It is not automatically the system of record for customer balances or the authoritative accounting ledger.
5. Canonical data models
The analytical pipeline validates schemas, handles duplicates, resolves references, and applies consistent business definitions.
This layer should distinguish source facts from derived interpretations. For example, an executed trade is a source business fact; a daily volume metric is a derived analytical measure.
6. Analytical facts and dimensions
Curated trade facts and related dimensions serve reporting and analysis. Ledger facts or ledger-derived datasets serve financial reconciliation and accounting analysis, with appropriate controls.
Risk and operational projections can use different freshness and aggregation strategies.
7. Reconciliation
The platform compares the expected results of financial postings with the relevant account balances, sub-ledgers, custody records, and external statements.
A green ingestion dashboard does not prove that customer balances reconcile.
That distinction matters more than most architecture diagrams admit.
6. How do you choose the right model?
Let's make the choice practical rather than philosophical.
| Requirement | Primary model | Why |
|---|---|---|
| Create and update orders | Normalized operational model | Clear entities and transactional rules |
| Represent partial fills | Trade execution model | One order can produce many executions |
| Reconstruct order lifecycle | Event model or history table | Preserves transitions over time |
| Calculate customer financial balances | Ledger and balance projection | Traceable financial effects |
| Calculate daily trading volume | Dimensional fact model | Clear grain and aggregations |
| Analyze fees by market and customer segment | Fact tables plus dimensions | Reusable analytical context |
| Investigate late or duplicated events | Event history plus processing metadata | Supports replay and diagnosis |
| Monitor current risk exposure | Purpose-built risk projection | Designed for the required freshness |
| Reconcile customer liabilities | Ledger, account model, and reconciliation records | Financial control and explainability |
The word primary matters. A use case may rely on multiple models. A risk dashboard may combine execution facts, current positions, prices, and account information—but each input should retain its own semantics and freshness guarantees.
Five questions I ask before approving a data model
1. What does one row represent?
If the team cannot answer this in one sentence, the grain is not settled.
2. What is the authoritative source?
If the trade table, event stream, and ledger disagree, which system owns the truth for that specific business fact? The answer may differ by domain.
3. What must never happen?
Examples include duplicate postings, negative available balances where prohibited, invalid asset precision, or a trade being counted twice.
Turn these into enforceable invariants and tests.
4. Can we reconstruct the past?
Can we explain the balance at a historical point in time? Can we distinguish when something happened from when the platform learned about it?
5. Who pays for this design?
A normalized model may simplify writes but increase analytical join complexity. A denormalized model may improve reads but introduce update and consistency challenges. A ledger may improve auditability but require more sophisticated controls and operational support.
The best model makes the trade-offs explicit.
7. A Staff Engineer's deep dive: the decisions that separate a good model from a production-grade one
The broad modeling pattern is only the beginning. The details below are where seemingly reasonable designs tend to fail.
7.1 Define the grain before designing the table
Consider these two datasets:
fact_order: one row per order, with current or carefully defined final state.fact_trade_execution: one row per executed trade.
Suppose an order fills three times. If we join one order row to three execution rows and then sum the order's original requested quantity, we may count the requested amount three times.
If we instead sum the execution quantities, we can correctly derive the total filled amount—provided the execution records are unique and the join preserves their grain.
A useful rule:
Every fact table should declare its grain, and every join should be reviewed for whether it preserves or changes that grain.
This is especially important when joining:
Trades to order history.
Trades to fee records.
Ledger entries to transaction metadata.
Positions to market-price history.
Customer records to slowly changing dimensions.
Never assume a join is one-to-one because the column names look compatible.
7.2 Money and quantity are not ordinary floating-point numbers
Financial data should not be modeled with casual numeric choices.
For prices, quantities, fees, and balances, use an explicitly defined precision and scale. In many relational systems, fixed-precision decimal types are appropriate; integer representations in defined atomic units can also work when the unit and range are carefully specified.
For example:
executed_quantity DECIMAL(38, 18),
execution_price   DECIMAL(38, 18),
fee_amount        DECIMAL(38, 18)
These are illustrative types, not a blanket recommendation to use DECIMAL(38,18) for every field. Precision and scale should reflect the assets, business rules, supported ranges, and target engine.
Avoid using binary floating-point types for values that require exact decimal accounting semantics.
Also define:
Asset-specific quantity precision.
Price precision and tick size.
Rounding rules.
Fee calculation rules.
Conversion rates and valuation timestamps.
Overflow behavior.
The unit of every amount.
A value of 100 is meaningless without context. Is it 100 BTC, 100 satoshis, 100 USDT, or 100 micro-units?
A number without its unit is not a financial data model. It's a future incident.
7.3 Separate event time, processing time, and business-effective time
In streaming systems, these timestamps answer different questions:
Event time: when the source says the event occurred.
Processing time: when a consumer processed it.
Business-effective time: when the event takes effect under the relevant business rules.
In some systems, event time and business-effective time may be identical. In others, they differ.
Imagine a trade executed at 10:15 but delivered to analytics at 10:18 because of a consumer lag.
If we group by processing time, the trade may appear in the wrong reporting interval.
Now imagine a correction arrives the following day for a previously reported trade. We may need both the original effective date and the date the correction was recorded.
For financial reporting, a single timestamp column rarely captures everything needed.
7.4 Design for duplicate delivery
Kafka consumers, retries, and recovery workflows can result in repeated delivery. An analytical pipeline must not assume that every received message represents a new business event.
A robust ingestion strategy typically includes:
Stable event identifiers.
Source-specific business keys.
Deduplication rules with a defined scope.
Idempotent processing.
Checkpointing and replay procedures.
Monitoring for conflicting duplicates.
There is an important distinction between delivery deduplication and business uniqueness. Two different event IDs could still describe the same business execution if the upstream system generates identifiers incorrectly or the source contract is misunderstood.
For ledger postings, duplicate protection must exist at the financial transaction boundary, not merely in a downstream dashboard.
7.5 Make corrections and late-arriving data first-class citizens
What happens if a trade is corrected, a fee is refunded, or an external settlement arrives late?
Overwriting the original analytical row may make the current report look right while destroying the ability to explain the previously reported result.
Instead, decide explicitly whether the domain needs:
Immutable original events.
Reversal and adjustment records.
Current-state projections.
Valid-time and recorded-time history.
Restatement of affected aggregates.
Versioned reports or close-period snapshots.
Not every domain needs full bitemporal modeling. But financial reporting and audit-sensitive workflows often need more than a single mutable current-state row.
The key is to make correction semantics explicit before the first correction arrives.
7.6 Treat schema evolution as a contract
A Kafka event with a new field may be easy to produce but can break consumers, change assumptions, or silently alter downstream metrics.
For every event and curated table, define:
Field meanings and units.
Required versus optional fields.
Nullability rules.
Compatibility expectations.
Enum evolution.
Versioning strategy.
Deprecation policy.
Ownership and change approval.
A schema registry can help enforce compatibility, but a registry cannot decide whether a new field has the correct business meaning.
Technical compatibility is not the same as semantic compatibility.
Changing fee_amount from “charged fee” to “estimated fee” may preserve the schema perfectly and still break the business.
7.7 Separate financial truth from analytical convenience
A cached balance is useful. A materialized view is useful. A Delta table containing the latest known account balance is useful.
None of these automatically becomes the authoritative financial record.
A derived balance should have a clear relationship to its source ledger, a defined freshness guarantee, and a reconciliation mechanism.
Similarly, a daily revenue aggregate should document whether it represents fees charged, fees posted, fees recognized as revenue, or net fees after rebates and reversals.
Those terms may overlap in a simple example. In production, they can diverge significantly.
8. The dangerous join: how a correct pipeline produces a wrong financial report
Let's return to OrbitX.
Assume fact_trade_execution contains the two BTC fills from our example.
Our expected trading volume is:
$$[ 12{,}000 + 5{,}990 = 17{,}990\ \text{USDT} ]$$
Now suppose the order-history table contains three records for the same order:
Order accepted.
Order partially filled.
Order canceled.
A careless join on order_id produces three joined rows for each trade if the relationship is many-to-many through the chosen tables.
The resulting dataset may contain six rows instead of two.
If we sum trade_notional after this join:
$$[ 3 \times 17{,}990 = 53{,}970\ \text{USDT} ]$$
The report now shows three times the actual execution volume.
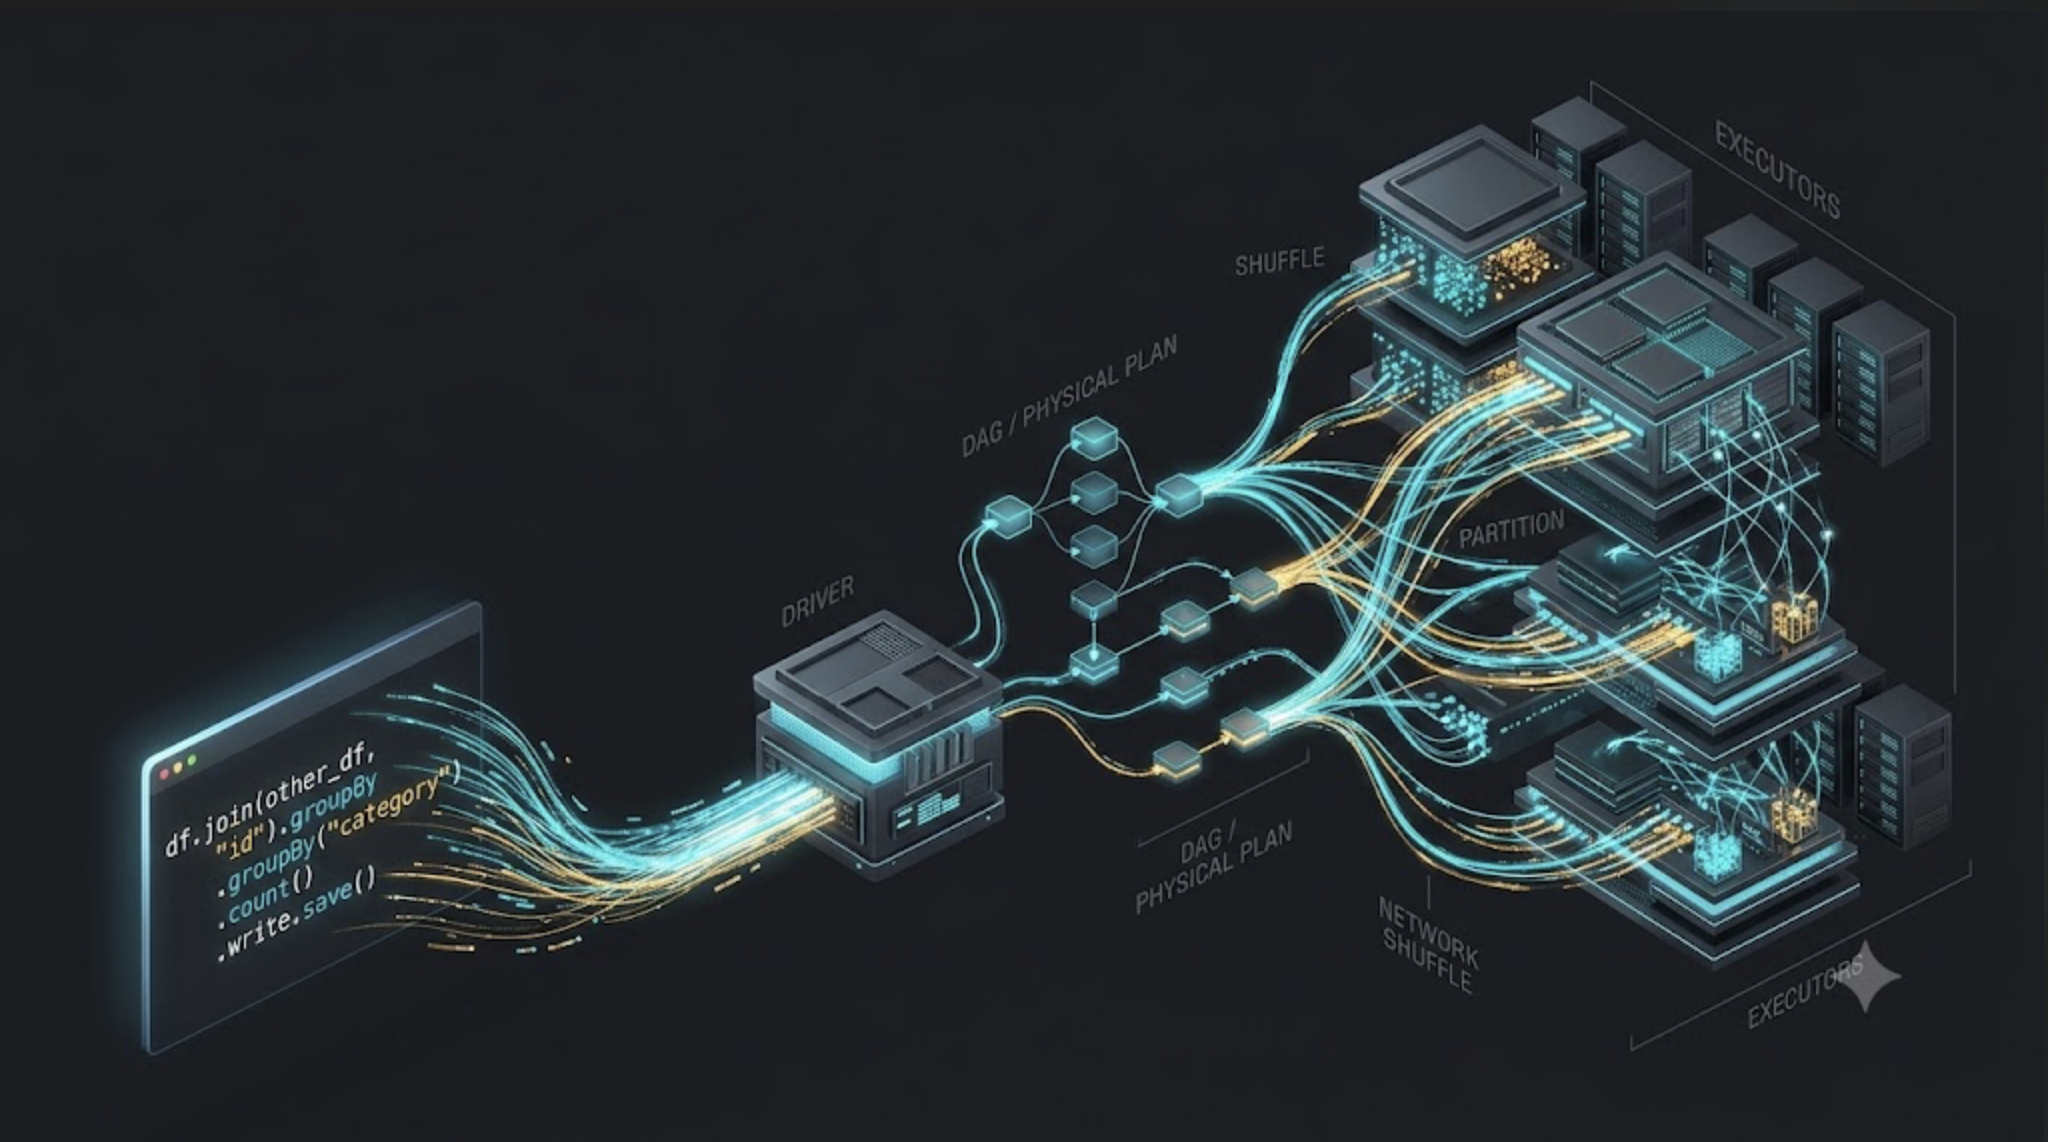
Spark can distribute that query across hundreds of executors. AQE can adapt the physical execution plan. Delta Lake can store the result efficiently.
And the number can still be wrong.
This is why data modeling must precede performance tuning.
How I would fix it
Define the trade fact grain as one row per unique execution.
Keep order lifecycle events in a separate event/history model.
Aggregate trade facts at the intended grain before joining to any one-to-many descriptive data, when appropriate.
Use a dimension or a deliberately selected order snapshot when the business question requires order attributes.
Validate row counts, distinct trade IDs, and aggregate totals before and after joins.
Add automated tests that fail when a supposedly one-to-one relationship becomes one-to-many.
For example:
-- Verify that the trade fact has one row per trade_id.
SELECT
    trade_id,
    COUNT(*) AS row_count
FROM fact_trade_execution
GROUP BY trade_id
HAVING COUNT(*) > 1;
For a model where trade_id must be unique, this query should return no rows.
And validate the expected volume independently:
SELECT
    SUM(trade_notional) AS total_trade_volume
FROM fact_trade_execution
WHERE execution_date = DATE '2026-10-19'
  AND asset_pair = 'BTC/USDT';
This is only a simple illustration. A production metric must define the reporting timezone, inclusion criteria, corrections, duplicate handling, and whether the volume is gross, net, or otherwise adjusted.
9. How this translates into a lakehouse architecture
If the exchange uses Kafka, S3, Spark, and Delta Lake, a practical analytical layout could look like this.
Bronze: preserve the received data
Store raw events with ingestion metadata, source identifiers, schema versions, and enough information to investigate or replay them.
Do not confuse raw retention with guaranteed completeness. Monitor source delivery, retention gaps, and failed ingestion.
Silver: enforce business meaning
Build validated canonical datasets for orders, executions, ledger postings, transfers, and fees.
Apply explicit rules for:
Deduplication.
Schema validation.
Decimal handling.
Event ordering where needed.
Late-arriving events.
Referential integrity.
Correction and reversal semantics.
This is where the platform should become trustworthy—not just tidy.
Gold: serve defined business questions
Build consumer-oriented models such as:
fact_trade_executionfact_fee_postingfact_ledger_entryfact_transferdim_assetdim_marketdim_accountagg_daily_trading_volume
Not every table needs to be a star schema, and not every consumer needs the same grain. Risk projections and account-balance snapshots may need their own modeling patterns.
The important point is that every curated dataset should declare its grain, ownership, freshness, and business definitions.
What should we monitor?
A production-grade data model needs more than pipeline-success metrics.
| Area | Example check | Why it matters |
|---|---|---|
| Completeness | Source executions versus ingested executions | Detect missing data |
| Uniqueness | Duplicate trade_id or posting key |
Prevent double counting |
| Referential integrity | Execution references a valid order | Preserve relationships |
| Financial integrity | Ledger balancing rules | Detect invalid postings |
| Reconciliation | Internal balances versus independent control totals | Identify unexplained differences |
| Freshness | Event time to curated availability | Understand reporting delay |
| Accuracy | Independent volume and fee checks | Validate calculations |
| Schema health | Unexpected type or contract changes | Catch producer-consumer breaks |
| Recovery | Replay does not repeat financial effects | Protect against duplicate processing |
A pipeline can be green while a reconciliation check is red. In a financial platform, those statuses should not carry the same operational meaning.
10. Five modeling mistakes I would challenge in a design review
Mistake 1: One giant table for everything
Why it fails: It mixes different grains, responsibilities, and update patterns.
Better choice: Separate orders, executions, ledger postings, and analytical facts. Connect them with stable identifiers.
Mistake 2: Treating the latest balance as the complete history
Why it fails: A current snapshot cannot, by itself, explain how the balance was reached.
Better choice: Maintain a defensible financial record and derive balance views with explicit rules.
Mistake 3: Using a star schema as the accounting system
Why it fails: Analytical convenience does not automatically provide transactional guarantees, posting controls, or auditability.
Better choice: Keep the ledger and analytical model distinct, with traceable links between them.
Mistake 4: Assuming exactly-once delivery solves every duplicate
Why it fails: Delivery guarantees do not replace business-level idempotency, unique transaction identities, or reconciliation.
Better choice: Define idempotency at each business boundary and test replay behavior.
Mistake 5: Optimizing before defining correctness
Why it fails: Faster queries can amplify the impact of bad assumptions.
Better choice: Establish grain, invariants, authoritative sources, and validation tests first. Then optimize the physical layout and execution.
11. A practical decision framework for Staff Engineers
When reviewing a new financial data domain, I would drive the design in this order.
Step 1 — Define business concepts. Agree on what an order, trade, fee, transfer, posting, balance, and revenue measure mean.
Step 2 — Declare the system of record. Identify which component owns each fact and which components provide derived views.
Step 3 — Write the invariants. Examples: one canonical execution identity, no duplicate financial posting, explicit asset units, and valid ledger balancing rules.
Step 4 — Choose the grain. Define one row per order, execution, journal entry, state transition, or aggregate—never leave it implicit.
Step 5 — Select the model per workload. Use normalized models for operational entities, event models for transitions, ledger models for financial effects, and dimensional models for analytics where appropriate.
Step 6 — Design for failure. Define retries, duplicate handling, late events, corrections, replay, and reconciliation before production launch.
Step 7 — Define the data contract. Document schema, units, precision, timestamps, ownership, retention, and compatibility.
Step 8 — Validate independently. Use reconciliation totals, duplicate checks, invariants, and known business examples to verify the output.
Step 9 — Optimize with evidence. Only after correctness is established, choose partitioning, clustering, materialization, indexing, or denormalization based on measured query patterns.
Step 10 — Make ownership explicit. Assign responsibility for business definitions, schema changes, data quality, and incident resolution.
This is how I would approach the design as a Staff Engineer: not by insisting on one favorite modeling technique, but by making the trade-offs visible and ensuring that the chosen design can survive real operational behavior.
12. Interview questions worth being ready for
Q1. Why not use a single denormalized table for a crypto exchange?
Because orders, executions, ledger entries, and transfers have different grains and lifecycles. A single table can create duplication, ambiguous semantics, and difficult correction logic. Denormalization can still be useful in carefully designed serving tables.
Q2. What is the most important property of a fact table?
A clearly defined grain. Measures and joins must be consistent with that grain.
Q3. Is an event-sourced model the same as a ledger?
No. An event model records business occurrences and transitions. A ledger records financial postings under accounting rules. Events may trigger postings, but the two concepts serve different purposes.
Q4. How would you prevent double-counting trade volume?
Use stable execution identifiers, enforce uniqueness in the canonical trade model, understand join cardinalities, and validate totals independently. Do not assume a successful pipeline guarantees a correct aggregate.
Q5. How would you model a fee refund?
Preserve the original fee and represent the refund or correction explicitly according to the accounting model. Link the adjustment to the original fee and define how net fees and revenue are reported.
Q6. When would you use a normalized model instead of a star schema?
For transactional workloads that need clear entity boundaries, controlled updates, and operational integrity. For analytical workloads, a star schema often makes queries and metric definitions easier to manage.
Q7. How do you model historical balances?
Use the financial record and account semantics to derive historical balances, or maintain validated snapshots for efficient access. Define the cutoff time, treatment of pending items, and reconciliation rules.
Q8. Why does event time matter in streaming analytics?
Because processing time can differ from when the business event occurred. Without explicit timestamp semantics, late-arriving events can distort reporting windows and historical metrics.
Q9. Does Delta Lake guarantee that a financial model is correct?
No. Delta Lake provides useful storage and transaction capabilities, but business correctness still depends on the model, transformation logic, identity rules, reconciliation, and controls.
Q10. What would you review first in a Staff Engineer design review?
Business definitions, source-of-truth boundaries, grain, financial invariants, failure and correction handling, and reconciliation. Performance comes after those fundamentals are understood.
13. The final perspective: model the consequences, not just the columns
The more time I spend thinking about data platforms, the more I believe that data modeling is less about deciding where a column belongs and more about deciding what a system is allowed to claim.
Can we claim that a trade happened? The execution record should support that.
Can we claim that a customer balance changed? The financial postings and account rules should support that.
Can we claim that the exchange earned a particular amount of revenue? The applicable accounting policy and recognized revenue records should support that.
Can we claim that today's trading volume is correct? The execution model, reporting definition, and reconciliation checks should support that.
Each claim needs evidence. Each model should make the evidence easier to find, validate, and explain.
That is the difference between a collection of tables and a data platform people can trust.
Your database doesn't know what money means. Your schema doesn't understand risk. And your dashboard has absolutely no idea that it's lying.
Those responsibilities belong to us.
As engineers, we don't just model data. We model the rules that allow a business to trust its own numbers.
So before asking whether your tables are normalized, denormalized, partitioned, clustered, or optimized, ask a much harder question:
If Finance challenges this number tomorrow morning, can we prove where it came from, explain every transformation, and defend the result without a war room full of engineers?
If the answer is yes, you've built more than a performant pipeline.
You've built a system worthy of handling financial truth.
#DataEngineering #DataModeling #DataArchitecture #Crypto #FinTech #ApacheSpark #DataPlatform #StaffEngineer #DistributedSystems
About the author
- I am a Lead Data Infrastructure Architect with 13+ years of experience engineering high-throughput data platforms for fintech and consumer apps. I specialize in the Databricks Lakehouse ecosystem, PySpark, BigQuery, and Snowflake. I write about modern data architecture, cloud cost optimization (FinOps), declarative ELT pipelines, and scaling systems to process 100K+ events per second. When I'm not untangling complex legacy databases, I'm building zero-loss data quality frameworks.
Comments
Join the discussionNo comments yet. Be the first to comment.